Races in Addison, Texas (TX) Detailed Stats
Data:
Races - White alone (%)
Races - White alone (% change since 2000)
Races - Black alone (%)
Races - Black alone (% change since 2000)
Races - American Indian alone (%)
Races - American Indian alone (% change since 2000)
Races - Asian alone (%)
Races - Asian alone (% change since 2000)
Races - Hispanic (%)
Races - Hispanic (% change since 2000)
Races - Native Hawaiian and Other Pacific Islander alone (%)
Races - Native Hawaiian and Other Pacific Islander alone (% change since 2000)
Races - Two or more races(%)
Races - Two or more races(% change since 2000)
Races - Other race alone (%)
Races - Other race alone (% change since 2000)
Racial diversity
Place of birth - Born in state of residence (%)
Place of birth - Born in state of residence (%) - White
Place of birth - Born in state of residence (%) - Black or African American
Place of birth - Born in state of residence (%) - Asian
Place of birth - Born in state of residence (%) - Hispanic or Latino
Place of birth - Born in state of residence (%) - American Indian and Alaska Native
Place of birth - Born in state of residence (%) - Multirace
Place of birth - Born in state of residence (%) - Other Race
Place of birth - Born in other state (%)
Place of birth - Born in other state (%) - White
Place of birth - Born in other state (%) - Black or African American
Place of birth - Born in other state (%) - Asian
Place of birth - Born in other state (%) - Hispanic or Latino
Place of birth - Born in other state (%) - American Indian and Alaska Native
Place of birth - Born in other state (%) - Multirace
Place of birth - Born in other state (%) - Other Race
Place of birth - Native, outside of US (%)
Place of birth - Native, outside of US (%) - White
Place of birth - Native, outside of US (%) - Black or African American
Place of birth - Native, outside of US (%) - Asian
Place of birth - Native, outside of US (%) - Hispanic or Latino
Place of birth - Native, outside of US (%) - American Indian and Alaska Native
Place of birth - Native, outside of US (%) - Multirace
Place of birth - Native, outside of US (%) - Other Race
Place of birth - Foreign born (%)
Place of birth - Foreign born (%) - White
Place of birth - Foreign born (%) - Black or African American
Place of birth - Foreign born (%) - Asian
Place of birth - Foreign born (%) - Hispanic or Latino
Place of birth - Foreign born (%) - American Indian and Alaska Native
Place of birth - Foreign born (%) - Multirace
Place of birth - Foreign born (%) - Other Race
Residents speaking English at home (%)
Residents speaking English at home - Born in the United States (%)
Residents speaking English at home - Native, born elsewhere (%)
Residents speaking English at home - Foreign born (%)
Residents speaking Spanish at home (%)
Residents speaking Spanish at home - Born in the United States (%)
Residents speaking Spanish at home - Native, born elsewhere (%)
Residents speaking Spanish at home - Foreign born (%)
Residents speaking other language at home (%)
Residents speaking other language at home - Born in the United States (%)
Residents speaking other language at home - Native, born elsewhere (%)
Residents speaking other language at home - Foreign born (%)
Marital status - Never married (%)
Marital status - Now married (%)
Marital status - Separated (%)
Marital status - Widowed (%)
Marital status - Divorced (%)
Ancestries Reported - Arab (%)
Ancestries Reported - Czech (%)
Ancestries Reported - Danish (%)
Ancestries Reported - Dutch (%)
Ancestries Reported - English (%)
Ancestries Reported - French (%)
Ancestries Reported - French Canadian (%)
Ancestries Reported - German (%)
Ancestries Reported - Greek (%)
Ancestries Reported - Hungarian (%)
Ancestries Reported - Irish (%)
Ancestries Reported - Italian (%)
Ancestries Reported - Lithuanian (%)
Ancestries Reported - Norwegian (%)
Ancestries Reported - Polish (%)
Ancestries Reported - Portuguese (%)
Ancestries Reported - Russian (%)
Ancestries Reported - Scotch-Irish (%)
Ancestries Reported - Scottish (%)
Ancestries Reported - Slovak (%)
Ancestries Reported - Subsaharan African (%)
Ancestries Reported - Swedish (%)
Ancestries Reported - Swiss (%)
Ancestries Reported - Ukrainian (%)
Ancestries Reported - United States (%)
Ancestries Reported - Welsh (%)
Ancestries Reported - West Indian (%)
Ancestries Reported - Other (%)
Geographical mobility - Same house 1 year ago (%)
Geographical mobility - Same house 1 year ago (%) - White
Geographical mobility - Same house 1 year ago (%) - Black or African American
Geographical mobility - Same house 1 year ago (%) - Asian
Geographical mobility - Same house 1 year ago (%) - Hispanic or Latino
Geographical mobility - Same house 1 year ago (%) - American Indian and Alaska Native
Geographical mobility - Same house 1 year ago (%) - Multirace
Geographical mobility - Same house 1 year ago (%) - Other Race
Geographical mobility - Moved within same county (%)
Geographical mobility - Moved within same county (%) - White
Geographical mobility - Moved within same county (%) - Black or African American
Geographical mobility - Moved within same county (%) - Asian
Geographical mobility - Moved within same county (%) - Hispanic or Latino
Geographical mobility - Moved within same county (%) - American Indian and Alaska Native
Geographical mobility - Moved within same county (%) - Multirace
Geographical mobility - Moved within same county (%) - Other Race
Geographical mobility - Moved from different county within same state (%)
Geographical mobility - Moved from different county within same state (%) - White
Geographical mobility - Moved from different county within same state (%) - Black or African American
Geographical mobility - Moved from different county within same state (%) - Asian
Geographical mobility - Moved from different county within same state (%) - Hispanic or Latino
Geographical mobility - Moved from different county within same state (%) - American Indian and Alaska Native
Geographical mobility - Moved from different county within same state (%) - Multirace
Geographical mobility - Moved from different county within same state (%) - Other Race
Geographical mobility - Moved from different state (%)
Geographical mobility - Moved from different state (%) - White
Geographical mobility - Moved from different state (%) - Black or African American
Geographical mobility - Moved from different state (%) - Asian
Geographical mobility - Moved from different state (%) - Hispanic or Latino
Geographical mobility - Moved from different state (%) - American Indian and Alaska Native
Geographical mobility - Moved from different state (%) - Multirace
Geographical mobility - Moved from different state (%) - Other Race
Geographical mobility - Moved from abroad (%)
Geographical mobility - Moved from abroad (%) - White
Geographical mobility - Moved from abroad (%) - Black or African American
Geographical mobility - Moved from abroad (%) - Asian
Geographical mobility - Moved from abroad (%) - Hispanic or Latino
Geographical mobility - Moved from abroad (%) - American Indian and Alaska Native
Geographical mobility - Moved from abroad (%) - Multirace
Geographical mobility - Moved from abroad (%) - Other Race
Place of birth for the foreign-born population - Ireland (%)
Place of birth for the foreign-born population - Denmark (%)
Place of birth for the foreign-born population - Norway (%)
Place of birth for the foreign-born population - Sweden (%)
Place of birth for the foreign-born population - United Kingdom (%)
Place of birth for the foreign-born population - England (%)
Place of birth for the foreign-born population - Scotland (%)
Place of birth for the foreign-born population - Other Northern Europe (%)
Place of birth for the foreign-born population - Austria (%)
Place of birth for the foreign-born population - Belgium (%)
Place of birth for the foreign-born population - France (%)
Place of birth for the foreign-born population - Germany (%)
Place of birth for the foreign-born population - Netherlands (%)
Place of birth for the foreign-born population - Switzerland (%)
Place of birth for the foreign-born population - Other Western Europe (%)
Place of birth for the foreign-born population - Greece (%)
Place of birth for the foreign-born population - Italy (%)
Place of birth for the foreign-born population - Portugal (%)
Place of birth for the foreign-born population - Spain (%)
Place of birth for the foreign-born population - Other Southern Europe (%)
Place of birth for the foreign-born population - Albania (%)
Place of birth for the foreign-born population - Belarus (%)
Place of birth for the foreign-born population - Bosnia and Herzegovina (%)
Place of birth for the foreign-born population - Bulgaria (%)
Place of birth for the foreign-born population - Croatia (%)
Place of birth for the foreign-born population - Czechoslovakia (%)
Place of birth for the foreign-born population - Hungary (%)
Place of birth for the foreign-born population - Latvia (%)
Place of birth for the foreign-born population - Lithuania (%)
Place of birth for the foreign-born population - North Macedonia (Macedonia) (%)
Place of birth for the foreign-born population - Moldova (%)
Place of birth for the foreign-born population - Poland (%)
Place of birth for the foreign-born population - Romania (%)
Place of birth for the foreign-born population - Russia (%)
Place of birth for the foreign-born population - Serbia (%)
Place of birth for the foreign-born population - Ukraine (%)
Place of birth for the foreign-born population - Other Eastern Europe (%)
Place of birth for the foreign-born population - China (%)
Place of birth for the foreign-born population - Hong Kong (%)
Place of birth for the foreign-born population - Taiwan (%)
Place of birth for the foreign-born population - Japan (%)
Place of birth for the foreign-born population - Korea (%)
Place of birth for the foreign-born population - Other Eastern Asia (%)
Place of birth for the foreign-born population - Afghanistan (%)
Place of birth for the foreign-born population - Bangladesh (%)
Place of birth for the foreign-born population - India (%)
Place of birth for the foreign-born population - Iran (%)
Place of birth for the foreign-born population - Kazakhstan (%)
Place of birth for the foreign-born population - Nepal (%)
Place of birth for the foreign-born population - Pakistan (%)
Place of birth for the foreign-born population - Sri Lanka (%)
Place of birth for the foreign-born population - Uzbekistan (%)
Place of birth for the foreign-born population - Other South Central Asia (%)
Place of birth for the foreign-born population - Burma (%)
Place of birth for the foreign-born population - Cambodia (%)
Place of birth for the foreign-born population - Indonesia (%)
Place of birth for the foreign-born population - Laos (%)
Place of birth for the foreign-born population - Malaysia (%)
Place of birth for the foreign-born population - Philippines (%)
Place of birth for the foreign-born population - Singapore (%)
Place of birth for the foreign-born population - Thailand (%)
Place of birth for the foreign-born population - Vietnam (%)
Place of birth for the foreign-born population - Other South Eastern Asia (%)
Place of birth for the foreign-born population - Armenia (%)
Place of birth for the foreign-born population - Iraq (%)
Place of birth for the foreign-born population - Israel (%)
Place of birth for the foreign-born population - Jordan (%)
Place of birth for the foreign-born population - Kuwait (%)
Place of birth for the foreign-born population - Lebanon (%)
Place of birth for the foreign-born population - Saudi Arabia (%)
Place of birth for the foreign-born population - Syria (%)
Place of birth for the foreign-born population - Turkey (%)
Place of birth for the foreign-born population - Yemen (%)
Place of birth for the foreign-born population - Other Western Asia (%)
Place of birth for the foreign-born population - Eritrea (%)
Place of birth for the foreign-born population - Ethiopia (%)
Place of birth for the foreign-born population - Kenya (%)
Place of birth for the foreign-born population - Somalia (%)
Place of birth for the foreign-born population - Uganda (%)
Place of birth for the foreign-born population - Zimbabwe (%)
Place of birth for the foreign-born population - Other Eastern Africa (%)
Place of birth for the foreign-born population - Cameroon (%)
Place of birth for the foreign-born population - Congo (%)
Place of birth for the foreign-born population - Democratic Republic of Congo (Zaire) (%)
Place of birth for the foreign-born population - Other Middle Africa (%)
Place of birth for the foreign-born population - Egypt (%)
Place of birth for the foreign-born population - Morocco (%)
Place of birth for the foreign-born population - Sudan (%)
Place of birth for the foreign-born population - Other Northern Africa (%)
Place of birth for the foreign-born population - South Africa (%)
Place of birth for the foreign-born population - Other Southern Africa (%)
Place of birth for the foreign-born population - Cabo Verde (%)
Place of birth for the foreign-born population - Ghana (%)
Place of birth for the foreign-born population - Liberia (%)
Place of birth for the foreign-born population - Nigeria (%)
Place of birth for the foreign-born population - Senegal (%)
Place of birth for the foreign-born population - Sierra Leone (%)
Place of birth for the foreign-born population - Other Western Africa (%)
Place of birth for the foreign-born population - Australia (%)
Place of birth for the foreign-born population - New Zealand (%)
Place of birth for the foreign-born population - Fiji (%)
Place of birth for the foreign-born population - Micronesia (%)
Place of birth for the foreign-born population - Bahamas (%)
Place of birth for the foreign-born population - Barbados (%)
Place of birth for the foreign-born population - Cuba (%)
Place of birth for the foreign-born population - Dominica (%)
Place of birth for the foreign-born population - Dominican Republic (%)
Place of birth for the foreign-born population - Grenada (%)
Place of birth for the foreign-born population - Haiti (%)
Place of birth for the foreign-born population - Jamaica (%)
Place of birth for the foreign-born population - St. Vincent and the Grenadines (%)
Place of birth for the foreign-born population - Trinidad and Tobago (%)
Place of birth for the foreign-born population - West Indies (%)
Place of birth for the foreign-born population - Other Caribbean (%)
Place of birth for the foreign-born population - Belize (%)
Place of birth for the foreign-born population - Costa Rica (%)
Place of birth for the foreign-born population - El Salvador (%)
Place of birth for the foreign-born population - Guatemala (%)
Place of birth for the foreign-born population - Honduras (%)
Place of birth for the foreign-born population - Mexico (%)
Place of birth for the foreign-born population - Nicaragua (%)
Place of birth for the foreign-born population - Panama (%)
Place of birth for the foreign-born population - Other Central America (%)
Place of birth for the foreign-born population - Argentina (%)
Place of birth for the foreign-born population - Bolivia (%)
Place of birth for the foreign-born population - Brazil (%)
Place of birth for the foreign-born population - Chile (%)
Place of birth for the foreign-born population - Colombia (%)
Place of birth for the foreign-born population - Ecuador (%)
Place of birth for the foreign-born population - Guyana (%)
Place of birth for the foreign-born population - Peru (%)
Place of birth for the foreign-born population - Uruguay (%)
Place of birth for the foreign-born population - Venezuela (%)
Place of birth for the foreign-born population - Other South America (%)
Place of birth for the foreign-born population - Canada (%)
Place of birth for the foreign-born population - Other Northern America (%)
Place of birth for the foreign-born population - Other (%)
Latest news about races in Addison, TX collected exclusively by city-data.com from local newspapers, TV, and radio stations
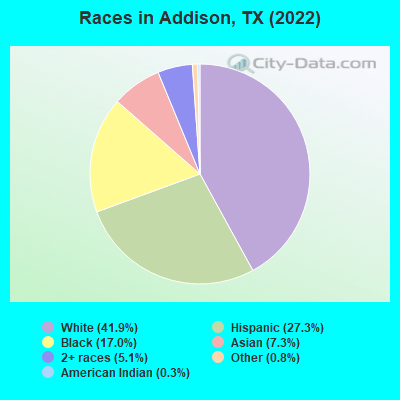
According to 2022 data, the most numerous races in Addison, TX are Hispanic (4,650 residents), White alone (7,124 residents), and Black alone (2,893 residents). 71.1% of Addison residents speak English at home. 24.1% of Addison, TX residents are foreign-born (12.2% born in Latin America, 5.8% born in Asia, 2.7% born in Europe), which is 29.6% greater than the foreign-born rate of 17.0% across the entire state of Texas.
Race distribution in Addison
2000 2022
10,933,313 52.4% White alone 6,669,666 32.0% Hispanic 2,364,255 11.3% Black alone 554,445 2.7% Asian alone 230,567 1.1% Two or more races 68,859 0.3% American Indian alone 19,958 0.10% Other race alone 10,757 0.05% Native Hawaiian and Other
12,070,642 40.2% Hispanic 11,683,430 38.9% White alone 3,508,706 11.7% Black alone 1,608,173 5.4% Asian alone 956,560 3.2% Two or more races 125,763 0.4% Other race alone 47,023 0.2% American Indian alone 29,275 0.10% Native Hawaiian and Other
Income and house value in Addison Median household income in 2022 $85,743 White non-Hispanic householders$60,104 Black householders$2,581 American Indian and Alaska Native householders$123,979 Asian householders$56,221 Some other race householders$59,579 Two or more races householders$57,786 Hispanic or Latino race householdersMedian 2022 house value $512,360 White Non-Hispanic householders$633,539 Black or African American householders $464,672 Asian householders$504,067 Two or more races householders$427,120 Hispanic or Latino householders
Median age by race in Addison
38.7 Median age for White residents39.6 38.3 33.4 Median age for Black or African American residents34.0 30.1 25.4 Median age for American Indian / Alaska Native residents-670,422,534.5 28.1 37.2 Median age for Asian residents32.2 38.2 -711,469,533.3 Median age for Native Hawaiian / Pacific Islander residents-815,813,116.9 -464,594,127.3 31.4 Median age for Other race residents31.8 31.5 31.4 Median age for Two or more races residents29.9 33.9 37.5 Median age for White alone residents37.0 39.8 30.3 Median age for Hispanic or Latino residents29.9 30.8
Owner/renter occupied households by race in Addison
House owners and renters - White residents 1,165 26.0% Owner occupied3,323 74.0% Renter occupiedHouse owners and renters - Black or African American residents 46 2.9% Owner occupied1,510 97.1% Renter occupiedHouse owners and renters - American Indian / Alaska Native residents 29 78.7% Owner occupied8 21.3% Renter occupiedHouse owners and renters - Asian residents 99 10.8% Owner occupied820 89.2% Renter occupiedHouse owners and renters - Other race residents 907 100.0% Renter occupiedHouse owners and renters - Two or more races residents 186 11.1% Owner occupied1,497 88.9% Renter occupiedHouse owners and renters - White alone residents 1,270 27.2% Owner occupied3,407 72.8% Renter occupiedHouse owners and renters - Hispanic or Latino residents 175 8.0% Owner occupied2,007 92.0% Renter occupied
Language usage in Addison
English speakers - Total 71.1% of residents of Addison speak English at home.
20.6% of residents speak Spanish at home 1,770 52.7% Speak English very well1,590 47.3% Speak English less than very well8.7% of residents speak other language at home 1,193 83.8% Speak English very well231 16.2% Speak English less than very well
English speakers - Born in the United States 86.9% of residents of Addison speak English at home.
7.6% of residents speak Spanish at home 376 83.0% Speak English very well77 17.0% Speak English less than very well5.3% of residents speak other language at home 259 82.7% Speak English very well54 17.3% Speak English less than very well
English speakers - Native, born elsewhere 55.1% of residents of Addison speak English at home.
15.0% of residents speak Spanish at home 13 40.6% Speak English very well19 59.4% Speak English less than very well46.3% of residents speak other language at home 99 100.0% Speak English very well
English speakers - Foreign-born 29.3% of residents of Addison speak English at home.
49.8% of residents speak Spanish at home 652 33.9% Speak English very well1,270 66.1% Speak English less than very well22.3% of residents speak other language at home 664 77.0% Speak English very well198 23.0% Speak English less than very well
White (Caucasian) - Speak only English Native:
100.0% (6,386)Foreign-born:
34.4% (223)
White (Caucasian) - Speak another language Native:
5.1% (328)Foreign-born:
69.6% (451)
Black or African American - Speak only English Native:
90.4% (2,116)Foreign-born:
47.7% (174)
Black or African American - Speak another language Native:
9.0% (211)Foreign-born:
48.6% (177)
American Indian / Alaska Native - Speak another language Native:
8.2% (8)Foreign-born:
100.0% (22)
Asian - Speak only English Native:
25.1% (101)Foreign-born:
52.9% (439)
Asian - Speak another language Native:
77.3% (310)Foreign-born:
45.1% (375)
Other race - Speak only English Native:
33.8% (193)Foreign-born:
9.4% (97)
Other race - Speak another language Native:
66.4% (380)Foreign-born:
90.5% (933)
Two or more races - Speak only English Native:
60.2% (1,272)Foreign-born:
18.2% (175)
Two or more races - Speak another language Native:
36.3% (767)Foreign-born:
83.5% (805)
White alone - Speak only English Native:
98.1% (6,440)Foreign-born:
33.5% (112)
White alone - Speak another language Native:
2.2% (145)Foreign-born:
66.1% (221)
Hispanic or Latino - Speak only English Native:
43.4% (1,014)Foreign-born:
14.9% (324)
Hispanic or Latino - Speak another language Native:
57.3% (1,337)Foreign-born:
87.7% (1,904)
Foreign-born residents in Addison 4,105 residents are foreign born (12.2% Latin America , 5.8% Asia , 2.7% Europe ).
This city:
24.1%Texas:
17.1%
Marital status for residents in Addison Marital status - White (Caucasian) population 15 years and over
Males 42.8% Never married40.9% Now married1.0% Separated1.6% Widowed13.7% DivorcedFemales 40.0% Never married32.3% Now married1.6% Separated7.2% Widowed19.0% DivorcedWomen who gave birth in the past 12 months Now married:
100.0% (165)Unmarried:
0.0% (0)
Women who did not give birth in the past 12 months Now married:
28.9% (522)Unmarried:
71.1% (1,283)
Marital status - Black or African American population 15 years and over
Males 57.0% Never married25.1% Now married1.8% Separated0.0% Widowed16.1% DivorcedFemales 62.4% Never married18.1% Now married0.9% Separated1.4% Widowed17.2% DivorcedWomen who gave birth in the past 12 months Now married:
40.0% (27)Unmarried:
60.0% (41)
Women who did not give birth in the past 12 months Now married:
20.1% (206)Unmarried:
79.9% (818)
Marital status - American Indian / Alaska Native population 15 years and over
Males 0.0% Never married100.0% Now married0.0% Separated0.0% Widowed0.0% DivorcedFemales 67.4% Never married32.6% Now married0.0% Separated0.0% Widowed0.0% DivorcedWomen who did not give birth in the past 12 months Now married:
25.6% (21)Unmarried:
74.4% (62)
Marital status - Asian population 15 years and over
Males 54.7% Never married24.8% Now married0.0% Separated0.0% Widowed20.5% DivorcedFemales 40.5% Never married47.6% Now married1.8% Separated0.0% Widowed10.0% DivorcedWomen who gave birth in the past 12 months Now married:
100.0% (9)Unmarried:
0.0% (0)
Women who did not give birth in the past 12 months Now married:
49.0% (204)Unmarried:
51.0% (212)
Marital status - Other race population 15 years and over
Males 58.0% Never married35.8% Now married0.0% Separated0.0% Widowed6.2% DivorcedFemales 35.4% Never married42.1% Now married12.4% Separated5.0% Widowed5.0% DivorcedWomen who did not give birth in the past 12 months Now married:
50.6% (287)Unmarried:
49.4% (280)
Marital status - Two or more races population 15 years and over
Males 54.2% Never married44.1% Now married0.0% Separated0.0% Widowed1.8% DivorcedFemales 45.5% Never married28.7% Now married1.6% Separated0.0% Widowed24.2% DivorcedWomen who did not give birth in the past 12 months Now married:
20.1% (201)Unmarried:
79.9% (799)
Marital status - White alone, not Hispanic / Latino population 15 years and over
Males 41.4% Never married42.2% Now married1.2% Separated1.7% Widowed13.4% DivorcedFemales 35.7% Never married32.1% Now married0.9% Separated9.0% Widowed22.3% DivorcedWomen who gave birth in the past 12 months Now married:
100.0% (225)Unmarried:
0.0% (0)
Women who did not give birth in the past 12 months Now married:
23.7% (413)Unmarried:
76.3% (1,330)
Marital status - Hispanic or Latino population 15 years and over
Males 53.7% Never married36.4% Now married0.0% Separated0.5% Widowed9.4% DivorcedFemales 49.3% Never married34.3% Now married5.1% Separated1.2% Widowed10.1% DivorcedWomen who gave birth in the past 12 months Now married:
100.0% (5)Unmarried:
0.0% (0)
Women who did not give birth in the past 12 months Now married:
37.3% (614)Unmarried:
62.7% (1,034)
Ancestries in Addison
526 5.4% English487 5.0% German382 3.9% Irish376 3.8% Italian340 3.5% American229 2.3% European166 1.7% Scotch-Irish112 1.1% French Canadian97 1.0% Ghanaian72 0.7% Nigerian70 0.7% British64 0.7% Trinidadian and Tobagonian59 0.6% South African38 0.4% Dutch33 0.3% Albanian31 0.3% Kenyan30 0.3% Iranian30 0.3% Scottish29 0.3% Czech27 0.3% Danish27 0.3% Polish25 0.3% Bulgarian25 0.3% Scandinavian23 0.2% Lebanese23 0.2% Macedonian23 0.2% Norwegian22 0.2% Finnish19 0.2% Lithuanian19 0.2% Eastern European18 0.2% Jamaican12 0.1% French11 0.1% Cajun10 0.1% West Indian7 0.07% Slovak6 0.06% Slavic6 0.06% Swedish6 0.06% Ukrainian5 0.05% Austrian3 0.03% Swiss2 0.02% Greek
Geographical mobility in Addison Same house 1 year ago 4,591 68.0% White (Caucasian)2,228 78.1% Black or African American45 38.5% American Indian / Alaska Native1,013 81.3% Asian912 53.5% Other race2,470 79.2% Two or more races4,961 71.3% White alone, not Hispanic / Latino3,051 65.8% Hispanic or LatinoMoved within same county 1,154 17.1% White / Caucasian185 6.5% Black or African American48 40.9% American Indian / Alaska Native118 9.5% Asian314 18.4% Other race201 6.4% Two or more races938 13.5% White alone, not Hispanic / Latino863 18.6% Hispanic or LatinoMoved within same state 662 9.8% White / Caucasian205 7.2% Black or African American40 3.2% Asian268 15.7% Other race207 6.6% Two or more races532 7.6% White alone, not Hispanic / Latino469 10.1% Hispanic or LatinoMoved from different state 456 6.8% White / Caucasian272 9.5% Black or African American23 1.8% Asian124 4.0% Two or more races466 6.7% White alone, not Hispanic / Latino51 1.1% Hispanic or LatinoMoved from abroad 29 0.4% White142 8.4% Other race76 2.4% Two or more races53 0.8% White alone, not Hispanic / Latino170 3.7% Hispanic or Latino
Children Nativity (place of birth) in Addison
Children under 6 years - Living with two parents Both parents native 301 100.0% NativeBoth parents foreign-born 121 100.0% NativeOne native, one foreign-born parent 75 100.0% NativeChildren under 6 years - Living with one parent Native parent 189 100.0% NativeForeign-born parent 96 100.0% NativeChildren 6 to 17 years - Living with two parents Both parents native 145 97.6% Native4 2.4% Foreign-bornBoth parents foreign-born 128 54.2% Native108 45.8% Foreign-bornOne native, one foreign-born parent 27 100.0% NativeChildren 6 to 17 years - Living with one parent Native parent 378 100.0% NativeForeign-born parent 260 50.7% Native253 49.3% Foreign-born
Grandparents responsible for own grandchildren in Addison
Grandparents (30 to 59 years) White / Caucasian 7 100.0% Responsible for grandchildrenBlack or African American 75 100.0% Responsible for grandchildrenWhite alone, not Hispanic / Latino 15 100.0% Responsible for grandchildren
Grandparents (60 years and over) Black or African American 16 100.0% Not responsible for grandchildren