Races in Acworth, Georgia (GA) Detailed Stats
Data:
Races - White alone (%)
Races - White alone (% change since 2000)
Races - Black alone (%)
Races - Black alone (% change since 2000)
Races - American Indian alone (%)
Races - American Indian alone (% change since 2000)
Races - Asian alone (%)
Races - Asian alone (% change since 2000)
Races - Hispanic (%)
Races - Hispanic (% change since 2000)
Races - Native Hawaiian and Other Pacific Islander alone (%)
Races - Native Hawaiian and Other Pacific Islander alone (% change since 2000)
Races - Two or more races(%)
Races - Two or more races(% change since 2000)
Races - Other race alone (%)
Races - Other race alone (% change since 2000)
Racial diversity
Place of birth - Born in state of residence (%)
Place of birth - Born in state of residence (%) - White
Place of birth - Born in state of residence (%) - Black or African American
Place of birth - Born in state of residence (%) - Asian
Place of birth - Born in state of residence (%) - Hispanic or Latino
Place of birth - Born in state of residence (%) - American Indian and Alaska Native
Place of birth - Born in state of residence (%) - Multirace
Place of birth - Born in state of residence (%) - Other Race
Place of birth - Born in other state (%)
Place of birth - Born in other state (%) - White
Place of birth - Born in other state (%) - Black or African American
Place of birth - Born in other state (%) - Asian
Place of birth - Born in other state (%) - Hispanic or Latino
Place of birth - Born in other state (%) - American Indian and Alaska Native
Place of birth - Born in other state (%) - Multirace
Place of birth - Born in other state (%) - Other Race
Place of birth - Native, outside of US (%)
Place of birth - Native, outside of US (%) - White
Place of birth - Native, outside of US (%) - Black or African American
Place of birth - Native, outside of US (%) - Asian
Place of birth - Native, outside of US (%) - Hispanic or Latino
Place of birth - Native, outside of US (%) - American Indian and Alaska Native
Place of birth - Native, outside of US (%) - Multirace
Place of birth - Native, outside of US (%) - Other Race
Place of birth - Foreign born (%)
Place of birth - Foreign born (%) - White
Place of birth - Foreign born (%) - Black or African American
Place of birth - Foreign born (%) - Asian
Place of birth - Foreign born (%) - Hispanic or Latino
Place of birth - Foreign born (%) - American Indian and Alaska Native
Place of birth - Foreign born (%) - Multirace
Place of birth - Foreign born (%) - Other Race
Residents speaking English at home (%)
Residents speaking English at home - Born in the United States (%)
Residents speaking English at home - Native, born elsewhere (%)
Residents speaking English at home - Foreign born (%)
Residents speaking Spanish at home (%)
Residents speaking Spanish at home - Born in the United States (%)
Residents speaking Spanish at home - Native, born elsewhere (%)
Residents speaking Spanish at home - Foreign born (%)
Residents speaking other language at home (%)
Residents speaking other language at home - Born in the United States (%)
Residents speaking other language at home - Native, born elsewhere (%)
Residents speaking other language at home - Foreign born (%)
Marital status - Never married (%)
Marital status - Now married (%)
Marital status - Separated (%)
Marital status - Widowed (%)
Marital status - Divorced (%)
Ancestries Reported - Arab (%)
Ancestries Reported - Czech (%)
Ancestries Reported - Danish (%)
Ancestries Reported - Dutch (%)
Ancestries Reported - English (%)
Ancestries Reported - French (%)
Ancestries Reported - French Canadian (%)
Ancestries Reported - German (%)
Ancestries Reported - Greek (%)
Ancestries Reported - Hungarian (%)
Ancestries Reported - Irish (%)
Ancestries Reported - Italian (%)
Ancestries Reported - Lithuanian (%)
Ancestries Reported - Norwegian (%)
Ancestries Reported - Polish (%)
Ancestries Reported - Portuguese (%)
Ancestries Reported - Russian (%)
Ancestries Reported - Scotch-Irish (%)
Ancestries Reported - Scottish (%)
Ancestries Reported - Slovak (%)
Ancestries Reported - Subsaharan African (%)
Ancestries Reported - Swedish (%)
Ancestries Reported - Swiss (%)
Ancestries Reported - Ukrainian (%)
Ancestries Reported - United States (%)
Ancestries Reported - Welsh (%)
Ancestries Reported - West Indian (%)
Ancestries Reported - Other (%)
Geographical mobility - Same house 1 year ago (%)
Geographical mobility - Same house 1 year ago (%) - White
Geographical mobility - Same house 1 year ago (%) - Black or African American
Geographical mobility - Same house 1 year ago (%) - Asian
Geographical mobility - Same house 1 year ago (%) - Hispanic or Latino
Geographical mobility - Same house 1 year ago (%) - American Indian and Alaska Native
Geographical mobility - Same house 1 year ago (%) - Multirace
Geographical mobility - Same house 1 year ago (%) - Other Race
Geographical mobility - Moved within same county (%)
Geographical mobility - Moved within same county (%) - White
Geographical mobility - Moved within same county (%) - Black or African American
Geographical mobility - Moved within same county (%) - Asian
Geographical mobility - Moved within same county (%) - Hispanic or Latino
Geographical mobility - Moved within same county (%) - American Indian and Alaska Native
Geographical mobility - Moved within same county (%) - Multirace
Geographical mobility - Moved within same county (%) - Other Race
Geographical mobility - Moved from different county within same state (%)
Geographical mobility - Moved from different county within same state (%) - White
Geographical mobility - Moved from different county within same state (%) - Black or African American
Geographical mobility - Moved from different county within same state (%) - Asian
Geographical mobility - Moved from different county within same state (%) - Hispanic or Latino
Geographical mobility - Moved from different county within same state (%) - American Indian and Alaska Native
Geographical mobility - Moved from different county within same state (%) - Multirace
Geographical mobility - Moved from different county within same state (%) - Other Race
Geographical mobility - Moved from different state (%)
Geographical mobility - Moved from different state (%) - White
Geographical mobility - Moved from different state (%) - Black or African American
Geographical mobility - Moved from different state (%) - Asian
Geographical mobility - Moved from different state (%) - Hispanic or Latino
Geographical mobility - Moved from different state (%) - American Indian and Alaska Native
Geographical mobility - Moved from different state (%) - Multirace
Geographical mobility - Moved from different state (%) - Other Race
Geographical mobility - Moved from abroad (%)
Geographical mobility - Moved from abroad (%) - White
Geographical mobility - Moved from abroad (%) - Black or African American
Geographical mobility - Moved from abroad (%) - Asian
Geographical mobility - Moved from abroad (%) - Hispanic or Latino
Geographical mobility - Moved from abroad (%) - American Indian and Alaska Native
Geographical mobility - Moved from abroad (%) - Multirace
Geographical mobility - Moved from abroad (%) - Other Race
Place of birth for the foreign-born population - Ireland (%)
Place of birth for the foreign-born population - Denmark (%)
Place of birth for the foreign-born population - Norway (%)
Place of birth for the foreign-born population - Sweden (%)
Place of birth for the foreign-born population - United Kingdom (%)
Place of birth for the foreign-born population - England (%)
Place of birth for the foreign-born population - Scotland (%)
Place of birth for the foreign-born population - Other Northern Europe (%)
Place of birth for the foreign-born population - Austria (%)
Place of birth for the foreign-born population - Belgium (%)
Place of birth for the foreign-born population - France (%)
Place of birth for the foreign-born population - Germany (%)
Place of birth for the foreign-born population - Netherlands (%)
Place of birth for the foreign-born population - Switzerland (%)
Place of birth for the foreign-born population - Other Western Europe (%)
Place of birth for the foreign-born population - Greece (%)
Place of birth for the foreign-born population - Italy (%)
Place of birth for the foreign-born population - Portugal (%)
Place of birth for the foreign-born population - Spain (%)
Place of birth for the foreign-born population - Other Southern Europe (%)
Place of birth for the foreign-born population - Albania (%)
Place of birth for the foreign-born population - Belarus (%)
Place of birth for the foreign-born population - Bosnia and Herzegovina (%)
Place of birth for the foreign-born population - Bulgaria (%)
Place of birth for the foreign-born population - Croatia (%)
Place of birth for the foreign-born population - Czechoslovakia (%)
Place of birth for the foreign-born population - Hungary (%)
Place of birth for the foreign-born population - Latvia (%)
Place of birth for the foreign-born population - Lithuania (%)
Place of birth for the foreign-born population - North Macedonia (Macedonia) (%)
Place of birth for the foreign-born population - Moldova (%)
Place of birth for the foreign-born population - Poland (%)
Place of birth for the foreign-born population - Romania (%)
Place of birth for the foreign-born population - Russia (%)
Place of birth for the foreign-born population - Serbia (%)
Place of birth for the foreign-born population - Ukraine (%)
Place of birth for the foreign-born population - Other Eastern Europe (%)
Place of birth for the foreign-born population - China (%)
Place of birth for the foreign-born population - Hong Kong (%)
Place of birth for the foreign-born population - Taiwan (%)
Place of birth for the foreign-born population - Japan (%)
Place of birth for the foreign-born population - Korea (%)
Place of birth for the foreign-born population - Other Eastern Asia (%)
Place of birth for the foreign-born population - Afghanistan (%)
Place of birth for the foreign-born population - Bangladesh (%)
Place of birth for the foreign-born population - India (%)
Place of birth for the foreign-born population - Iran (%)
Place of birth for the foreign-born population - Kazakhstan (%)
Place of birth for the foreign-born population - Nepal (%)
Place of birth for the foreign-born population - Pakistan (%)
Place of birth for the foreign-born population - Sri Lanka (%)
Place of birth for the foreign-born population - Uzbekistan (%)
Place of birth for the foreign-born population - Other South Central Asia (%)
Place of birth for the foreign-born population - Burma (%)
Place of birth for the foreign-born population - Cambodia (%)
Place of birth for the foreign-born population - Indonesia (%)
Place of birth for the foreign-born population - Laos (%)
Place of birth for the foreign-born population - Malaysia (%)
Place of birth for the foreign-born population - Philippines (%)
Place of birth for the foreign-born population - Singapore (%)
Place of birth for the foreign-born population - Thailand (%)
Place of birth for the foreign-born population - Vietnam (%)
Place of birth for the foreign-born population - Other South Eastern Asia (%)
Place of birth for the foreign-born population - Armenia (%)
Place of birth for the foreign-born population - Iraq (%)
Place of birth for the foreign-born population - Israel (%)
Place of birth for the foreign-born population - Jordan (%)
Place of birth for the foreign-born population - Kuwait (%)
Place of birth for the foreign-born population - Lebanon (%)
Place of birth for the foreign-born population - Saudi Arabia (%)
Place of birth for the foreign-born population - Syria (%)
Place of birth for the foreign-born population - Turkey (%)
Place of birth for the foreign-born population - Yemen (%)
Place of birth for the foreign-born population - Other Western Asia (%)
Place of birth for the foreign-born population - Eritrea (%)
Place of birth for the foreign-born population - Ethiopia (%)
Place of birth for the foreign-born population - Kenya (%)
Place of birth for the foreign-born population - Somalia (%)
Place of birth for the foreign-born population - Uganda (%)
Place of birth for the foreign-born population - Zimbabwe (%)
Place of birth for the foreign-born population - Other Eastern Africa (%)
Place of birth for the foreign-born population - Cameroon (%)
Place of birth for the foreign-born population - Congo (%)
Place of birth for the foreign-born population - Democratic Republic of Congo (Zaire) (%)
Place of birth for the foreign-born population - Other Middle Africa (%)
Place of birth for the foreign-born population - Egypt (%)
Place of birth for the foreign-born population - Morocco (%)
Place of birth for the foreign-born population - Sudan (%)
Place of birth for the foreign-born population - Other Northern Africa (%)
Place of birth for the foreign-born population - South Africa (%)
Place of birth for the foreign-born population - Other Southern Africa (%)
Place of birth for the foreign-born population - Cabo Verde (%)
Place of birth for the foreign-born population - Ghana (%)
Place of birth for the foreign-born population - Liberia (%)
Place of birth for the foreign-born population - Nigeria (%)
Place of birth for the foreign-born population - Senegal (%)
Place of birth for the foreign-born population - Sierra Leone (%)
Place of birth for the foreign-born population - Other Western Africa (%)
Place of birth for the foreign-born population - Australia (%)
Place of birth for the foreign-born population - New Zealand (%)
Place of birth for the foreign-born population - Fiji (%)
Place of birth for the foreign-born population - Micronesia (%)
Place of birth for the foreign-born population - Bahamas (%)
Place of birth for the foreign-born population - Barbados (%)
Place of birth for the foreign-born population - Cuba (%)
Place of birth for the foreign-born population - Dominica (%)
Place of birth for the foreign-born population - Dominican Republic (%)
Place of birth for the foreign-born population - Grenada (%)
Place of birth for the foreign-born population - Haiti (%)
Place of birth for the foreign-born population - Jamaica (%)
Place of birth for the foreign-born population - St. Vincent and the Grenadines (%)
Place of birth for the foreign-born population - Trinidad and Tobago (%)
Place of birth for the foreign-born population - West Indies (%)
Place of birth for the foreign-born population - Other Caribbean (%)
Place of birth for the foreign-born population - Belize (%)
Place of birth for the foreign-born population - Costa Rica (%)
Place of birth for the foreign-born population - El Salvador (%)
Place of birth for the foreign-born population - Guatemala (%)
Place of birth for the foreign-born population - Honduras (%)
Place of birth for the foreign-born population - Mexico (%)
Place of birth for the foreign-born population - Nicaragua (%)
Place of birth for the foreign-born population - Panama (%)
Place of birth for the foreign-born population - Other Central America (%)
Place of birth for the foreign-born population - Argentina (%)
Place of birth for the foreign-born population - Bolivia (%)
Place of birth for the foreign-born population - Brazil (%)
Place of birth for the foreign-born population - Chile (%)
Place of birth for the foreign-born population - Colombia (%)
Place of birth for the foreign-born population - Ecuador (%)
Place of birth for the foreign-born population - Guyana (%)
Place of birth for the foreign-born population - Peru (%)
Place of birth for the foreign-born population - Uruguay (%)
Place of birth for the foreign-born population - Venezuela (%)
Place of birth for the foreign-born population - Other South America (%)
Place of birth for the foreign-born population - Canada (%)
Place of birth for the foreign-born population - Other Northern America (%)
Place of birth for the foreign-born population - Other (%)
Latest news about races in Acworth, GA collected exclusively by city-data.com from local newspapers, TV, and radio stations
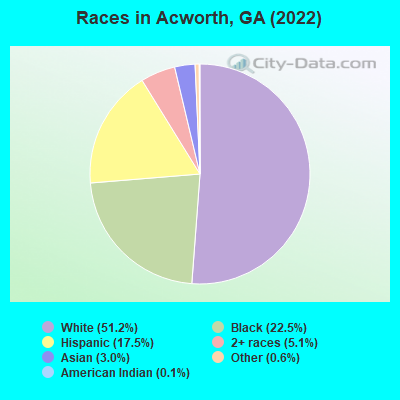
According to 2022 data, the most numerous races in Acworth, GA are White alone (11,522 residents), Black alone (5,062 residents), and Hispanic (3,926 residents). 71.3% of Acworth residents speak English at home. 17.6% of Acworth, GA residents are foreign-born (10.7% born in Latin America, 3.0% born in Asia, 2.4% born in Africa), which is 43.3% greater than the foreign-born rate of 10.0% across the entire state of Georgia.
Race distribution in Acworth
2000 2022
5,128,661 62.6% White alone 2,331,465 28.5% Black alone 435,227 5.3% Hispanic 171,513 2.1% Asian alone 87,364 1.1% Two or more races 17,670 0.2% American Indian alone 11,275 0.1% Other race alone 3,278 0.04% Native Hawaiian and Other
5,415,657 49.6% White alone 3,349,240 30.7% Black alone 1,132,604 10.4% Hispanic 479,156 4.4% Asian alone 462,923 4.2% Two or more races 54,416 0.5% Other race alone 11,923 0.1% American Indian alone 6,957 0.06% Native Hawaiian and Other
Income and house value in Acworth Median household income in 2022 $68,914 White non-Hispanic householders$83,058 Black householders$100,339 Asian householders$43,260 Some other race householders$86,444 Two or more races householders$64,180 Hispanic or Latino race householdersMedian 2022 house value $306,177 White Non-Hispanic householders$325,086 Black or African American householders $295,026 Asian householders$349,085 Some other race householders$331,873 Two or more races householders$335,267 Hispanic or Latino householders
Median age by race in Acworth
38.3 Median age for White residents37.6 41.8 40.6 Median age for Black or African American residents39.0 42.5 -621,333,332.7 Median age for American Indian / Alaska Native residents-622,065,727.1 -675,716,439.7 42.8 Median age for Asian residents47.5 42.1 -657,243,815.6 Median age for Native Hawaiian / Pacific Islander residents-693,227,090.9 -776,776,776.0 21.3 Median age for Other race residents19.1 43.7 23.1 Median age for Two or more races residents10.5 31.7 41.2 Median age for White alone residents37.3 45.1 22.9 Median age for Hispanic or Latino residents22.9 22.3
Owner/renter occupied households by race in Acworth
House owners and renters - White residents 3,324 61.2% Owner occupied2,107 38.8% Renter occupiedHouse owners and renters - Black or African American residents 1,035 61.5% Owner occupied649 38.5% Renter occupiedHouse owners and renters - American Indian / Alaska Native residents 31 100.0% Renter occupiedHouse owners and renters - Asian residents 217 90.5% Owner occupied23 9.5% Renter occupiedHouse owners and renters - Other race residents 300 65.5% Owner occupied158 34.5% Renter occupiedHouse owners and renters - Two or more races residents 406 70.8% Owner occupied167 29.2% Renter occupiedHouse owners and renters - White alone residents 3,239 61.3% Owner occupied2,049 38.7% Renter occupiedHouse owners and renters - Hispanic or Latino residents 614 61.1% Owner occupied391 38.9% Renter occupied
Language usage in Acworth
English speakers - Total 71.3% of residents of Acworth speak English at home.
14.1% of residents speak Spanish at home 1,691 56.1% Speak English very well1,323 43.9% Speak English less than very well15.1% of residents speak other language at home 2,303 71.1% Speak English very well935 28.9% Speak English less than very well
English speakers - Born in the United States 90.5% of residents of Acworth speak English at home.
7.3% of residents speak Spanish at home 433 69.5% Speak English very well190 30.5% Speak English less than very well2.2% of residents speak other language at home 166 87.4% Speak English very well24 12.6% Speak English less than very well
English speakers - Native, born elsewhere 45.4% of residents of Acworth speak English at home.
18.8% of residents speak Spanish at home 49 100.0% Speak English very well34.6% of residents speak other language at home 63 70.0% Speak English very well27 30.0% Speak English less than very well
English speakers - Foreign-born 16.0% of residents of Acworth speak English at home.
32.1% of residents speak Spanish at home 241 18.6% Speak English very well1,057 81.4% Speak English less than very well51.8% of residents speak other language at home 1,314 62.8% Speak English very well780 37.2% Speak English less than very well
White (Caucasian) - Speak only English Native:
90.6% (9,946)Foreign-born:
13.0% (99)
White (Caucasian) - Speak another language Native:
7.0% (770)Foreign-born:
81.3% (620)
Black or African American - Speak only English Native:
93.3% (3,118)Foreign-born:
20.9% (388)
Black or African American - Speak another language Native:
6.3% (210)Foreign-born:
82.2% (1,525)
Asian - Speak only English Native:
38.3% (203)Foreign-born:
12.3% (33)
Asian - Speak another language Native:
65.0% (345)Foreign-born:
87.3% (236)
Other race - Speak only English Native:
15.8% (180)Foreign-born:
8.6% (59)
Other race - Speak another language Native:
86.0% (976)Foreign-born:
89.9% (615)
Two or more races - Speak only English Native:
89.8% (1,251)Foreign-born:
5.0% (21)
Two or more races - Speak another language Native:
7.3% (101)Foreign-born:
91.6% (389)
White alone - Speak only English Native:
95.1% (9,911)Foreign-born:
18.5% (107)
White alone - Speak another language Native:
4.6% (478)Foreign-born:
78.0% (449)
Hispanic or Latino - Speak only English Native:
22.2% (500)Foreign-born:
5.6% (79)
Hispanic or Latino - Speak another language Native:
77.8% (1,750)Foreign-born:
94.4% (1,331)
Foreign-born residents in Acworth 3,968 residents are foreign born (10.7% Latin America , 3.0% Asia , 2.4% Africa ).
This city:
17.6%Georgia:
10.4%
Marital status for residents in Acworth Marital status - White (Caucasian) population 15 years and over
Males 28.4% Never married57.6% Now married1.1% Separated2.2% Widowed10.7% DivorcedFemales 28.0% Never married40.3% Now married0.4% Separated9.3% Widowed22.0% DivorcedWomen who gave birth in the past 12 months Now married:
94.4% (143)Unmarried:
5.6% (8)
Women who did not give birth in the past 12 months Now married:
44.2% (1,338)Unmarried:
55.8% (1,691)
Marital status - Black or African American population 15 years and over
Males 44.8% Never married46.3% Now married0.6% Separated0.9% Widowed7.3% DivorcedFemales 42.1% Never married42.0% Now married0.0% Separated7.4% Widowed8.4% DivorcedWomen who gave birth in the past 12 months Now married:
100.0% (102)Unmarried:
0.0% (0)
Women who did not give birth in the past 12 months Now married:
24.0% (270)Unmarried:
76.0% (855)
Marital status - American Indian / Alaska Native population 15 years and over
Males 0.0% Never married0.0% Now married0.0% Separated0.0% Widowed100.0% DivorcedFemales 100.0% Never married0.0% Now married0.0% Separated0.0% Widowed0.0% DivorcedWomen who did not give birth in the past 12 months Now married:
0.0% (0)Unmarried:
100.0% (14)
Marital status - Asian population 15 years and over
Males 36.6% Never married58.3% Now married0.0% Separated5.1% Widowed0.0% DivorcedFemales 42.3% Never married46.4% Now married0.0% Separated11.3% Widowed0.0% DivorcedWomen who did not give birth in the past 12 months Now married:
35.7% (74)Unmarried:
64.3% (133)
Marital status - Other race population 15 years and over
Males 59.5% Never married38.0% Now married0.0% Separated0.0% Widowed2.5% DivorcedFemales 31.5% Never married46.3% Now married5.2% Separated13.5% Widowed3.5% DivorcedWomen who gave birth in the past 12 months Now married:
100.0% (14)Unmarried:
0.0% (0)
Women who did not give birth in the past 12 months Now married:
44.4% (156)Unmarried:
55.6% (195)
Marital status - Two or more races population 15 years and over
Males 31.4% Never married36.3% Now married0.0% Separated0.0% Widowed32.3% DivorcedFemales 34.2% Never married26.7% Now married26.9% Separated2.6% Widowed9.5% DivorcedWomen who gave birth in the past 12 months Now married:
100.0% (37)Unmarried:
0.0% (0)
Women who did not give birth in the past 12 months Now married:
55.4% (322)Unmarried:
44.6% (259)
Marital status - White alone, not Hispanic / Latino population 15 years and over
Males 29.0% Never married56.1% Now married1.1% Separated2.4% Widowed11.4% DivorcedFemales 26.8% Never married39.8% Now married0.0% Separated10.1% Widowed23.3% DivorcedWomen who gave birth in the past 12 months Now married:
100.0% (126)Unmarried:
0.0% (0)
Women who did not give birth in the past 12 months Now married:
43.5% (1,210)Unmarried:
56.5% (1,574)
Marital status - Hispanic or Latino population 15 years and over
Males 43.2% Never married45.4% Now married0.0% Separated0.0% Widowed11.4% DivorcedFemales 34.9% Never married39.4% Now married13.5% Separated6.6% Widowed5.6% DivorcedWomen who gave birth in the past 12 months Now married:
85.9% (57)Unmarried:
14.1% (9)
Women who did not give birth in the past 12 months Now married:
51.3% (555)Unmarried:
48.7% (526)
Ancestries in Acworth
1,806 15.1% English1,290 10.8% Haitian876 7.3% American747 6.2% Irish647 5.4% German501 4.2% Palestinian385 3.2% Jamaican312 2.6% Italian127 1.1% Ethiopian127 1.1% African112 0.9% European107 0.9% French99 0.8% Polish93 0.8% Iranian70 0.6% Scottish69 0.6% Kenyan50 0.4% Canadian44 0.4% Swedish40 0.3% Brazilian40 0.3% Scotch-Irish35 0.3% Macedonian34 0.3% Belgian30 0.3% Moroccan25 0.2% Nigerian21 0.2% British14 0.1% Eastern European14 0.1% Ukrainian13 0.1% Russian12 0.1% Croatian10 0.08% Serbian10 0.08% West Indian9 0.08% Northern European8 0.07% Portuguese7 0.06% Welsh7 0.06% Slovak4 0.03% French Canadian4 0.03% Yugoslavian2 0.02% Dutch
Geographical mobility in Acworth Same house 1 year ago 10,349 84.1% White (Caucasian)4,670 93.8% Black or African American32 99.5% American Indian / Alaska Native774 100.0% Asian1,821 97.9% Other race1,686 82.9% Two or more races9,687 84.6% White alone, not Hispanic / Latino3,278 85.6% Hispanic or LatinoMoved within same county 846 6.9% White / Caucasian119 2.4% Black or African American27 1.5% Other race195 9.6% Two or more races715 6.2% White alone, not Hispanic / Latino395 10.3% Hispanic or LatinoMoved within same state 682 5.5% White / Caucasian53 1.1% Black or African American5 0.2% Other race49 2.4% Two or more races648 5.7% White alone, not Hispanic / Latino69 1.8% Hispanic or LatinoMoved from different state 252 2.0% White / Caucasian144 2.9% Black or African American15 0.8% Other race114 5.6% Two or more races253 2.2% White alone, not Hispanic / Latino112 2.9% Hispanic or LatinoMoved from abroad 37 0.3% White48 1.0% Black or African American25 1.4% Other race44 0.4% White alone, not Hispanic / Latino13 0.3% Hispanic or Latino
Children Nativity (place of birth) in Acworth
Children under 6 years - Living with two parents Both parents native 640 100.0% NativeBoth parents foreign-born 273 100.0% NativeOne native, one foreign-born parent 75 100.0% NativeChildren under 6 years - Living with one parent Native parent 65 100.0% NativeForeign-born parent 59 100.0% NativeChildren 6 to 17 years - Living with two parents Both parents native 1,764 99.5% Native8 0.5% Foreign-bornBoth parents foreign-born 1,031 71.2% Native417 28.8% Foreign-bornOne native, one foreign-born parent 379 100.0% NativeChildren 6 to 17 years - Living with one parent Native parent 669 100.0% NativeForeign-born parent 471 52.2% Native432 47.8% Foreign-born
Grandparents responsible for own grandchildren in Acworth
Grandparents (30 to 59 years) White / Caucasian 334 89.5% Responsible for grandchildren39 10.5% Not responsible for grandchildrenBlack or African American 40 100.0% Responsible for grandchildrenOther race 20 100.0% Not responsible for grandchildrenWhite alone, not Hispanic / Latino 223 82.9% Responsible for grandchildren46 17.1% Not responsible for grandchildrenHispanic or Latino 15 100.0% Not responsible for grandchildrenGrandparents (60 years and over) White / Caucasian 67 39.2% Responsible for grandchildren103 60.8% Not responsible for grandchildrenBlack or African American 76 100.0% Not responsible for grandchildrenWhite alone, not Hispanic / Latino 68 37.3% Responsible for grandchildren113 62.7% Not responsible for grandchildren