Hillside, New Jersey (NJ) Poverty Rate Data
Information about poor and low-income residents

Recent posts about poverty in Hillside, New Jersey on our local forum with over 2,400,000 registered users:
 | NJ property taxes outpacing economy - thoughts? (73 replies) |
| NJ Cities/Large Suburbs, Ranked (56 replies) |
| Majority Black middle class suburbs (98 replies) |
| What is your favorite County in the State? (58 replies) |
| Hello New Jersy (69 replies) |
| Considering buying a house in Union county. Any opinions on neighborhoods in Elizabeth, Union, or Hillside? (11 replies) |
Latest news about poverty in Hillside, NJ collected exclusively by city-data.com from local newspapers, TV, and radio stations
6.0% of Hillside, NJ residents had an income below the poverty level in 2022, which was 61.5% less than the poverty level of 9.7% across the entire state of New Jersey. Taking into account residents not living in families, 13.4% of high school graduates and 38.1% of non high school graduates live in poverty. The poverty rate was 9.9% among disabled males and 6.2% among disabled females. The renting rate among poor residents was 60.4%. For comparison, it was 26.0% among residents with income above the poverty level.
Poverty rates in Hillside, NJ
Residents with income below the poverty level in 2022:
Residents with income below 50% of the poverty level in 2022:
Poverty rate among disabled males:
Poverty rate among disabled females:
Renting rate in this place among poor and not poor residents:
| Hillside: | 6.0% |
| Whole state: | 9.7% |
| Hillside: | 2.7% |
| Whole state: | 4.4% |
Poverty rate among disabled males:
| Hillside: | 9.9% |
| New Jersey: | 11.3% |
Disability rate in this place among poor males (it is 16.4% among male residents who are not classified as poor):
| Hillside: | 35.0% |
| New Jersey: | 28.1% |
Poverty rate among disabled females:
| Hillside: | 6.2% |
| New Jersey: | 15.2% |
Disability rate in this place among poor females (it is 17.9% among female residents who are not classified as poor):
| Hillside: | 21.1% |
| New Jersey: | 29.6% |
Renting rate in this place among poor and not poor residents:
| Residents below poverty level: | 60.4% |
| Residents above poverty level: | 26.0% |
Poverty by age in Hillside, NJ
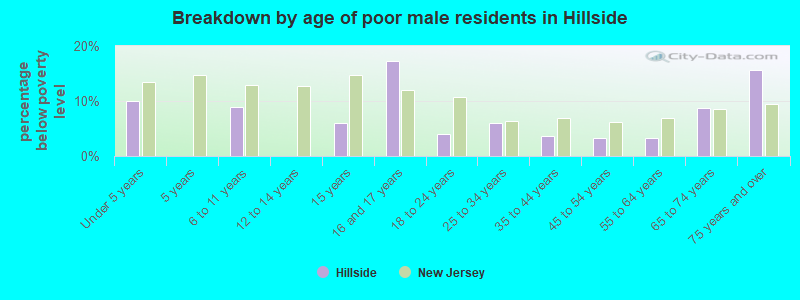
- Breakdown by age of poor male residents in Hillside,NJ (percentage below poverty level)
- 9.9%Under 5 years
- 0.0%5 years
- 8.9%6 to 11 years
- 0.0%12 to 14 years
- 6.0%15 years
- 17.2%16 and 17 years
- 3.9%18 to 24 years
- 6.0%25 to 34 years
- 3.6%35 to 44 years
- 3.4%45 to 54 years
- 3.4%55 to 64 years
- 8.8%65 to 74 years
- 15.6%75 years and over
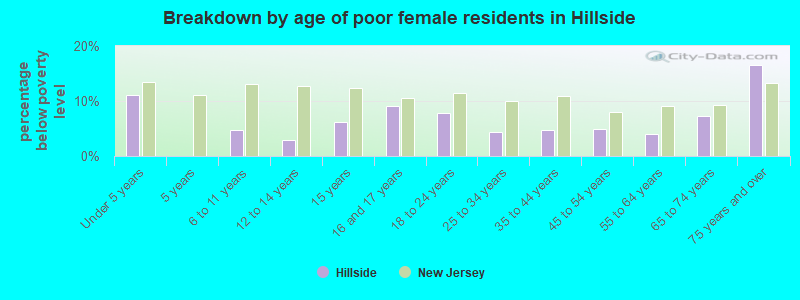
- Breakdown by age of poor female residents in Hillside,NJ (percentage below poverty level)
- 11.1%Under 5 years
- 0.0%5 years
- 4.8%6 to 11 years
- 2.9%12 to 14 years
- 6.2%15 years
- 9.0%16 and 17 years
- 7.9%18 to 24 years
- 4.3%25 to 34 years
- 4.7%35 to 44 years
- 4.9%45 to 54 years
- 4.0%55 to 64 years
- 7.3%65 to 74 years
- 16.6%75 years and over
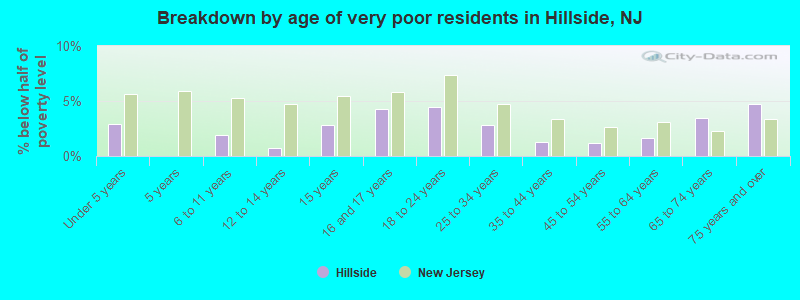
- Breakdown by age of very poor residents in Hillside,NJ (% below half of poverty level)
- 2.9%Under 5 years
- 0.0%5 years
- 1.9%6 to 11 years
- 0.7%12 to 14 years
- 2.8%15 years
- 4.3%16 and 17 years
- 4.5%18 to 24 years
- 2.8%25 to 34 years
- 1.3%35 to 44 years
- 1.2%45 to 54 years
- 1.6%55 to 64 years
- 3.5%65 to 74 years
- 4.7%75 years and over
Poverty by race and place of birth in Hillside, NJ
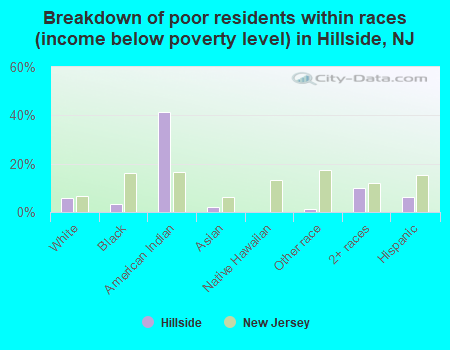
- Breakdown of poor residents within races in Hillside, NJ (%)
- 6.0%White
- 3.3%Black
- 41.5%American Indian
- 2.1%Asian
- 0.0%Native Hawaiian
- 1.2%Other race
- 9.9%2+ races
- 6.3%Hispanic
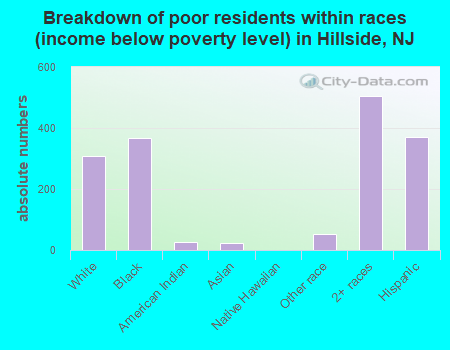
- Breakdown of poor residents within races in Hillside, NJ (absolute numbers)
- 307White
- 366Black
- 27American Indian
- 22Asian
- 0Native Hawaiian
- 52Other race
- 5052+ races
- 369Hispanic
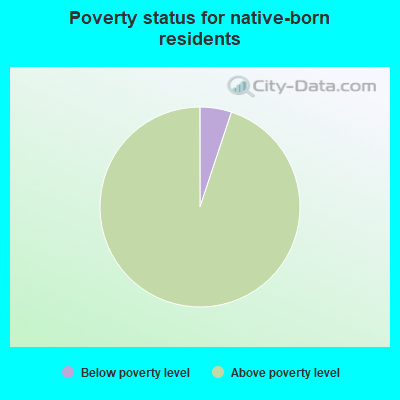
- 5.1%Below poverty level
- 94.9%Above poverty level
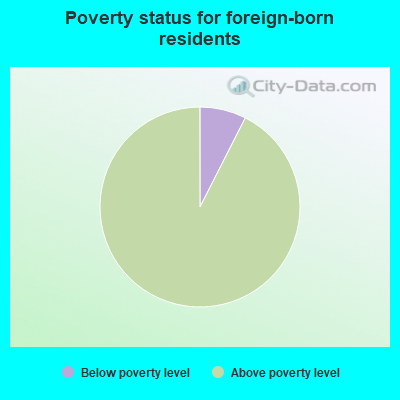
- 7.5%Below poverty level
- 92.5%Above poverty level
Poverty in families in Hillside, NJ
Children below poverty level:
| Hillside, New Jersey: | 6.8% |
| State: | 12.7% |
Poverty rate among high school graduates not in families:
| Hillside: | 13.4% |
| New Jersey: | 13.8% |
Poverty rate among people who did not graduate high school not in families:
| Hillside: | 38.1% |
| New Jersey: | 34.7% |
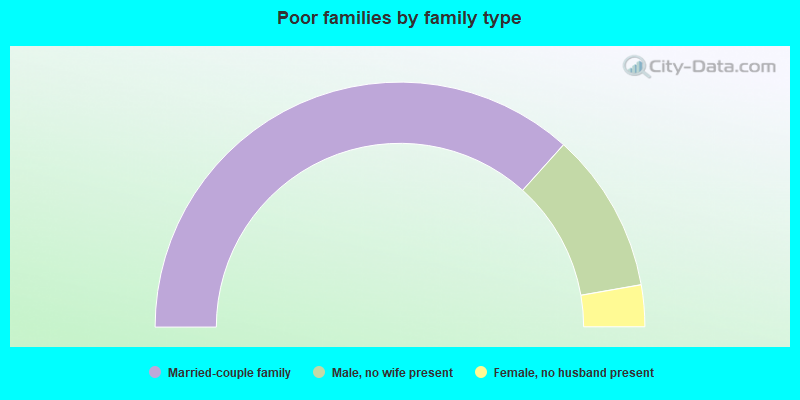
- 73.3%Married-couple family
- 21.2%Male, no wife present
- 5.5%Female, no husband present
Other data
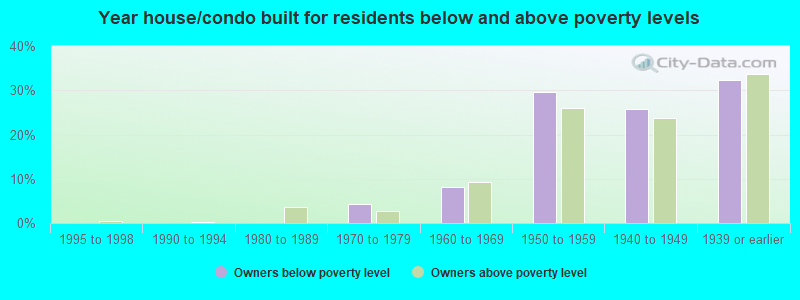
- Owners below poverty level
- 0.0%1999 to 2000
- 0.0%1995 to 1998
- 0.0%1990 to 1994
- 0.0%1980 to 1989
- 4.4%1970 to 1979
- 8.2%1960 to 1969
- 29.5%1950 to 1959
- 25.7%1940 to 1949
- 32.2%1939 or earlier
- Owners above poverty level
- 0.2%1999 to 2000
- 0.5%1995 to 1998
- 0.1%1990 to 1994
- 3.7%1980 to 1989
- 2.7%1970 to 1979
- 9.2%1960 to 1969
- 26.1%1950 to 1959
- 23.8%1940 to 1949
- 33.8%1939 or earlier