Woodley neighborhood in Falls Church, Virginia (VA), 22042 detailed profile
Settings
X


Business Search - 14 Million verified businesses
Area: 0.196 square miles
Population: 1,680
Population density:
| Woodley: | 8,576 people per square mile |
| Falls Church: | 7,340 people per square mile |

- 74443.9%Hispanic or Latino
- 68640.5%White
- 19011.2%Asian
- 352.1%Two or more races
- 251.5%Black
- 70.4%American Indian
- 70.4%Some other race

Median household income in 2022:
| Woodley: | $126,347 |
| Falls Church: | $164,536 |
Distribution of median household income
![Distribution of median household income]()
- 9Less than $10,000
- 11$10,000 to $19,999
- 26$20,000 to $29,999
- 18$30,000 to $39,999
- 15$40,000 to $49,999
- 57$50,000 to $59,999
- 14$60,000 to $74,999
- 60$75,000 to $99,999
- 68$100,000 to $124,999
- 35$125,000 to $149,999
- 111$150,000 to $199,999
- 140$200,000 or more

Distribution of owner-occupied house/condo value
![Distribution of owner-occupied house/condo value]()
- 4Less than $50,000
- 13$50,000 to $99,999
- 9$150,000 to $199,999
- 10$250,000 to $299,999
- 13$300,000 to $399,999
- 60$400,000 to $499,999
- 251$500,000 to $749,999
- 90$750,000 to $999,999
- 12$1,000,000 or more

Distribution of rent paid by renters
![Distribution of rent paid by renters]()
- 70$300 to $399
- 10$400 to $499
- 14$500 to $599
- 5$700 to $799
- 7$900 to $999
- 10$1,000 to $1,249
- 20$1,250 to $1,499
- 17$1,500 to $1,999
- 72$2,000 or more

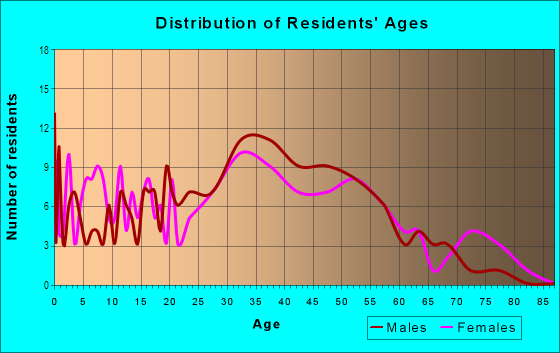
| Males: | 845 |
| Females: | 835 |
Males:
| This neighborhood: | 40.9 years |
| Whole city: | 36.7 years |
| This neighborhood: | 38.4 years |
| Whole city: | 41.5 years |
Average household size:
| Woodley: | 3.4 people |
| Falls Church: | 2.5 people |
Percentage of family households:
| Woodley: | 56.5% |
| Falls Church: | 46.0% |
| Here: | 58.3% |
| Falls Church: | 51.5% |
Percentage of married-couple families with children (among all households):
| Woodley: | 25.8% |
| Falls Church: | 33.1% |
Percentage of single-mother households (among all households):
| Woodley: | 1.4% |
| Falls Church: | 4.7% |
Percentage of never married males 15 years old and over:
Percentage of never married females 15 years old and over:
| Woodley: | 15.5% |
| Falls Church: | 17.9% |
Percentage of never married females 15 years old and over:
| Woodley: | 18.8% |
| city: | 16.2% |
Percentage of people that speak English not well or not at all:
| Woodley: | 22.4% |
| Falls Church: | 2.2% |
Percentage of people born in this state:
Percentage of people born in another U.S. state:
Percentage of native residents but born outside the U.S.:
Percentage of foreign born residents:
| Here: | 26.3% |
| Falls Church: | 26.5% |
Percentage of people born in another U.S. state:
| Woodley: | 25.6% |
| Falls Church: | 54.2% |
Percentage of native residents but born outside the U.S.:
| Here: | 1.7% |
| city: | 3.7% |
Percentage of foreign born residents:
| Here: | 46.4% |
| Falls Church: | 15.5% |

Owner-occupied
Renter-occupied


- Rooms in owner-occupied houses and condos in Woodley
- 01 room
- 02 rooms
- 263 rooms
- 124 rooms
- 345 rooms
- 956 rooms
- 627 rooms
- 928 rooms
- 1209+ rooms

- Rooms in renter-occupied apartments in Woodley
- 01 room
- 192 rooms
- 273 rooms
- 154 rooms
- 135 rooms
- 96 rooms
- 747 rooms
- 88 rooms
- 99+ rooms
Owner-occupied
Renter-occupied

- Bedrooms in owner-occupied houses and condos in Woodley
- 0no bedroom
- 91 bedroom
- 172 bedrooms
- 2043 bedrooms
- 1074 bedrooms
- 955+ bedrooms

- Bedrooms in renter-occupied apartments in Woodley
- 27no bedroom
- 191 bedroom
- 1352 bedrooms
- 243 bedrooms
- 404 bedrooms
- 745+ bedrooms
Average number of cars or other vehicles available in houses/condos:
Average number of cars or other vehicles available in apartments:
| This neighborhood: | 2.4 |
| Falls Church: | 1.9 |
Average number of cars or other vehicles available in apartments:
| Here: | 2.2 |
| city: | 1.4 |
Percentage of units with a mortgage:
| Woodley: | 81.1% |
| Falls Church: | 70.0% |
Average estimated value of detached houses in 2022 (94.6% of all units):
| Woodley: | $656,720 |
| Virginia: | $472,865 |

- Year house built in Woodley
- 02020 or later
- 382010 to 2019
- 02000 to 2009
- 171990 to 1999
- 111980 to 1989
- 541970 to 1979
- 701960 to 1969
- 2051950 to 1959
- 1291940 to 1949
- 201939 or earlier

City-data.com crime index for city in 2020 (higher means more crime):
| City: | 120.0 |
| U.S. average: | 219.5 |
Travel time to work (commute)
![Travel time to work (commute)]()
- 35Less than 5 minutes
- 335 to 9 minutes
- 3210 to 14 minutes
- 7315 to 19 minutes
- 13920 to 24 minutes
- 3525 to 29 minutes
- 9730 to 34 minutes
- 1035 to 39 minutes
- 3240 to 44 minutes
- 10145 to 59 minutes
- 14960 to 89 minutes
- 8490 or more minutes

Means of transportation to work
![Means of transportation to work]()
- 56.1%456Drove a car alone
- 15.6%127Carpooled
- 4.8%39Bus
- 3.3%27Subway or elevated rail
- 1.7%14Taxi
- 0.5%4Bicycle
- 3.9%32Walked
- 2.0%16Other means
- 16.4%133Worked at home

Time leaving home to go to work
![Time leaving home to go to work]()
- 2812:00 a.m. to 4:59 a.m.
- 535:00 a.m. to 5:29 a.m.
- 65:30 a.m. to 5:59 a.m.
- 1146:00 a.m. to 6:29 a.m.
- 286:30 a.m. to 6:59 a.m.
- 1347:00 a.m. to 7:29 a.m.
- 847:30 a.m. to 7:59 a.m.
- 1008:00 a.m. to 8:29 a.m.
- 348:30 a.m. to 8:59 a.m.
- 1149:00 a.m. to 9:59 a.m.
- 1210:00 a.m. to 10:59 a.m.
- 711:00 a.m. to 11:59 a.m.
- 5012:00 p.m. to 3:59 p.m.
- 324:00 p.m. to 11:59 p.m.

Occupations of males:
- Percentage of males in management occupations (except farmers):
Here: 13.5% city: 24.7%
- Percentage of males in business and financial operations occupations:
Here: 7.6% city: 9.3%
- Percentage of males in computer and mathematical occupations:
Here: 5.9% city: 15.0%
- Percentage of males in architecture and engineering occupations:
Here: 2.1% city: 3.6%
- Percentage of males in legal occupations:
Here: 1.5% city: 6.6%
- Percentage of males in arts, design, entertainment, sports, and media occupations:
Here: 8.4% city: 2.1%
- Percentage of males in service occupations:
Here: 7.4% city: 7.4%
- Percentage of males in sales and office occupations:
Here: 17.9% city: 12.4%
- Percentage of males in construction, extraction, and maintenance occupations:
Here: 25.1% city: 4.0%
- Percentage of males in production occupations:
Here: 2.5% city: 0.8%
- Percentage of males in transportation occupations:
Here: 2.0% city: 0.5%
Occupations of females:
- Percentage of females in management occupations (except farmers):
Here: 16.5% city: 15.1%
- Percentage of females in business and financial operations occupations:
Here: 7.1% city: 14.3%
- Percentage of females in computer and mathematical occupations:
Here: 5.0% city: 8.7%
- Percentage of females in life, physical, and social science occupations:
Here: 4.5% city: 2.7%
- Percentage of females in community and social services occupations:
Here: 1.7% city: 1.9%
- Percentage of females in legal occupations:
Here: 2.0% city: 4.6%
- Percentage of females in education, training, and library occupations:
Here: 7.0% city: 10.6%
- Percentage of females in arts, design, entertainment, sports, and media occupations:
Here: 1.7% city: 3.0%
- Percentage of females in healthcare practitioners and technical occupations:
Here: 4.1% city: 9.4%
- Percentage of females in service occupations:
Here: 19.7% city: 12.6%
- Percentage of females in sales and office occupations:
Here: 15.4% city: 15.9%
- Percentage of females in production occupations:
Here: 1.2% city: 0.0%
- Percentage of females in material moving occupations:
Here: 12.8% city: 0.5%
Percentage of people 16-64 in Armed Forces:
| Woodley: | 0.3% |
| Falls Church: | 1.3% |
Education in this neighborhood (subdivision or community):
- Percentage of people 3 years and older in K-12 schools:
Woodley: 15.1% Falls Church: 21.3%
- Percentage of people 3 years and older in undergraduate colleges:
Woodley: 6.7% Falls Church: 4.5%
- Percentage of people 3 years and older in grad. or professional schools:
Woodley: 1.5% Falls Church: 2.0%
- Percentage of students K-12 enrolled in private schools:
Woodley: 11.7% Falls Church: 11.0%
Percentage of population below poverty level:
| Woodley: | 7.9% |
| Falls Church: | 2.3% |
Median year owner moved in (as recorded in 2022):
| Woodley: | 2005 |
| Falls Church: | 2010 |
Percentage of married-couple families with both working:
| Woodley: | 82.2% |
| Falls Church: | 77.3% |

- 67.8%Utility gas
- 27.2%Electricity
- 4.3%Bottled, tank, or LP gas
- 0.7%Other fuel
Highways in this neighborhood:
US Hwy 50 (Arlington Blvd)
Length: 0.54 miles
Direction: E-W
Address range: 7016 to 7231
Direction: E-W
Address range: 7016 to 7231
Roads and streets:
Oak Ridge Rd
Length: 0.59 miles
Directions: E-W, N-S, SE-NW, SW-NE
Address range: 7001 to 7199
Directions: E-W, N-S, SE-NW, SW-NE
Address range: 7001 to 7199
Westmoreland Rd
Length: 0.52 miles
Direction: E-W
Address range: 7000 to 7299
Direction: E-W
Address range: 7000 to 7299
Woodley Ln
Length: 0.47 miles
Direction: E-W
Address range: 7016 to 7199
Direction: E-W
Address range: 7016 to 7199
Manor Rd
Length: 0.46 miles
Directions: E-W, N-S, SW-NE
Address range: 3000 to 3199
Directions: E-W, N-S, SW-NE
Address range: 3000 to 3199
Wayne Rd
Length: 0.40 miles
Direction: N-S
Address range: 3000 to 3199
Direction: N-S
Address range: 3000 to 3199
Alger Rd
Length: 0.36 miles
Directions: E-W, SW-NE
Address range: 7100 to 7298
Directions: E-W, SW-NE
Address range: 7100 to 7298
Graham Rd
Length: 0.32 miles
Directions: N-S, SE-NW
Address range: 3090 to 3154
Directions: N-S, SE-NW
Address range: 3090 to 3154
Noland Rd
Length: 0.27 miles
Directions: E-W, N-S, SW-NE
Address range: 7100 to 7299
Directions: E-W, N-S, SW-NE
Address range: 7100 to 7299
Hodge Pl
Length: 0.14 miles
Direction: N-S
Address range: 3100 to 3199
Direction: N-S
Address range: 3100 to 3199
Lewis Pl
Length: 0.05 miles
Directions: N-S, SW-NE
Address range: 3100 to 3199
Directions: N-S, SW-NE
Address range: 3100 to 3199
Fredsen Pl
Length: 0.01 miles
Direction: SE-NW
Address range: 3000 to 3099
Direction: SE-NW
Address range: 3000 to 3099