Whittier neighborhood in Denver, Colorado (CO), 80205 detailed profile
Settings
X


Business Search - 14 Million verified businesses
Area: 0.569 square miles
Population: 4,781
Population density:
| Whittier: | 8,396 people per square mile |
| Denver: | 4,651 people per square mile |

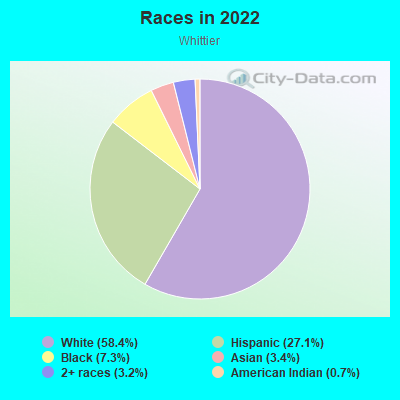
- 2,79558.4%White
- 1,29527.1%Hispanic or Latino
- 3477.3%Black
- 1613.4%Asian
- 1523.2%Two or more races
- 340.7%American Indian
- 10.02%Native Hawaiian and Other
Pacific Islander
Distribution of median household income
![Distribution of median household income]()
- 276Less than $10,000
- 160$10,000 to $19,999
- 370$20,000 to $29,999
- 158$30,000 to $39,999
- 101$40,000 to $49,999
- 57$50,000 to $59,999
- 37$60,000 to $74,999
- 157$75,000 to $99,999
- 120$100,000 to $124,999
- 154$125,000 to $149,999
- 515$150,000 to $199,999
- 440$200,000 or more

Distribution of owner-occupied house/condo value
![Distribution of owner-occupied house/condo value]()
- 46$50,000 to $99,999
- 28$100,000 to $149,999
- 82$150,000 to $199,999
- 22$200,000 to $249,999
- 37$250,000 to $299,999
- 52$300,000 to $399,999
- 258$400,000 to $499,999
- 697$500,000 to $749,999
- 136$750,000 to $999,999
- 140$1,000,000 or more

Distribution of rent paid by renters
![Distribution of rent paid by renters]()
- 153Less than $100
- 40$100 to $199
- 647$200 to $299
- 103$300 to $399
- 89$400 to $499
- 38$500 to $599
- 15$600 to $699
- 23$700 to $799
- 127$800 to $899
- 54$900 to $999
- 146$1,000 to $1,249
- 70$1,250 to $1,499
- 145$1,500 to $1,999
- 252$2,000 or more

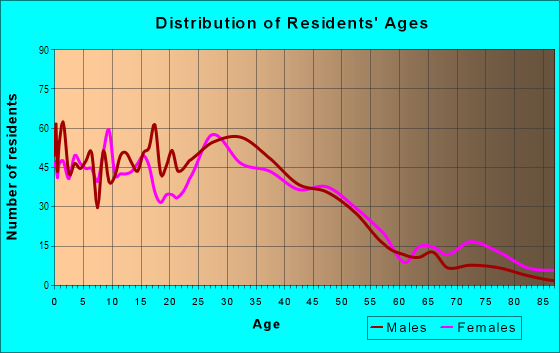
| Males: | 2,163 |
| Females: | 2,617 |
Males:
| This neighborhood: | 51.5 years |
| Whole city: | 35.2 years |
| This neighborhood: | 49.4 years |
| Whole city: | 35.1 years |
Average household size:
| Whittier: | 9.7 people |
| Denver: | 28.0 people |
Percentage of family households:
| Whittier: | 40.5% |
| Denver: | 35.1% |
| Here: | 27.7% |
| Denver: | 32.5% |
Percentage of married-couple families with children (among all households):
| Whittier: | 18.8% |
| Denver: | 32.4% |
Percentage of single-mother households (among all households):
| Whittier: | 28.0% |
| Denver: | 10.3% |
Percentage of never married males 15 years old and over:
Percentage of never married females 15 years old and over:
| Whittier: | 25.1% |
| Denver: | 25.0% |
Percentage of never married females 15 years old and over:
| Whittier: | 32.6% |
| city: | 20.8% |
Percentage of people that speak English not well or not at all:
| Whittier: | 0.0% |
| Denver: | 3.9% |
Percentage of people born in this state:
Percentage of people born in another U.S. state:
Percentage of native residents but born outside the U.S.:
Percentage of foreign born residents:
| Here: | 38.2% |
| Denver: | 38.5% |
Percentage of people born in another U.S. state:
| Whittier: | 56.9% |
| Denver: | 46.1% |
Percentage of native residents but born outside the U.S.:
| Here: | 0.4% |
| city: | 1.7% |
Percentage of foreign born residents:
| Here: | 4.5% |
| Denver: | 13.8% |
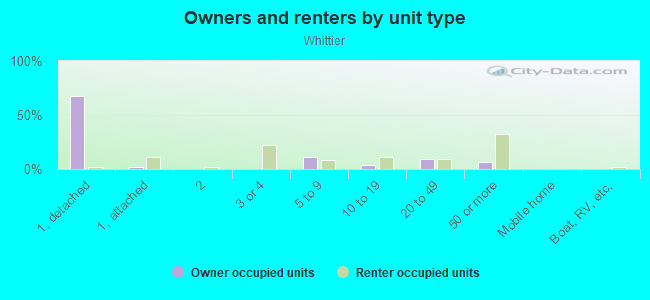
Owner-occupied
Renter-occupied

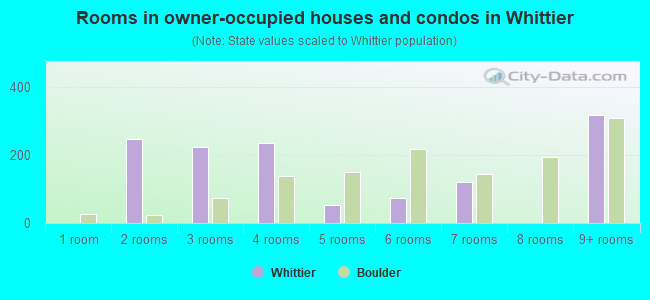
- Rooms in owner-occupied houses and condos in Whittier
- 131 room
- 642 rooms
- 1293 rooms
- 2884 rooms
- 3335 rooms
- 1826 rooms
- 1587 rooms
- 1478 rooms
- 1409+ rooms
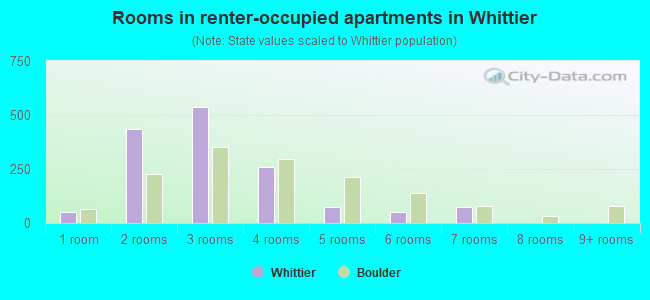
- Rooms in renter-occupied apartments in Whittier
- 1221 room
- 912 rooms
- 1423 rooms
- 5834 rooms
- 1185 rooms
- 526 rooms
- 237 rooms
- 2428 rooms
- 519+ rooms
Owner-occupied
Renter-occupied
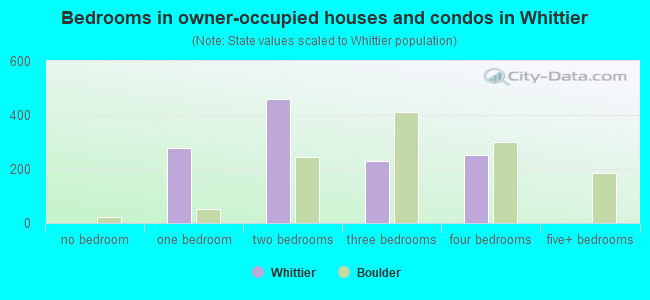
- Bedrooms in owner-occupied houses and condos in Whittier
- 13no bedroom
- 1321 bedroom
- 5202 bedrooms
- 4113 bedrooms
- 1404 bedrooms
- 1105+ bedrooms
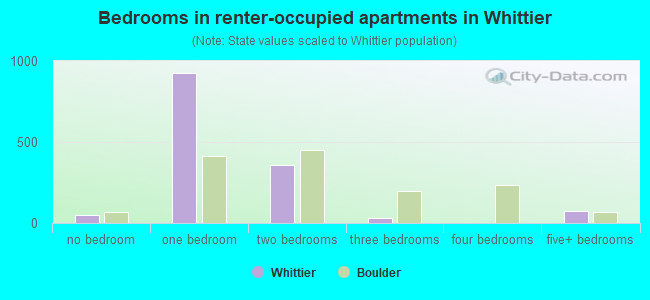
- Bedrooms in renter-occupied apartments in Whittier
- 122no bedroom
- 1481 bedroom
- 7782 bedrooms
- 973 bedrooms
- 74 bedrooms
- 605+ bedrooms
Average number of cars or other vehicles available in houses/condos:
Average number of cars or other vehicles available in apartments:
| This neighborhood: | 1.7 |
| Denver: | 1.9 |
Average number of cars or other vehicles available in apartments:
| Here: | 1.0 |
| city: | 1.3 |
Percentage of units with a mortgage:
| Whittier: | 88.3% |
| Denver: | 75.6% |
Housing prices:
- Average estimated value of detached houses in 2022 (41.1% of all units):
Whittier: $779,819 Colorado: $676,667
- Average estimated value of townhouses or other attached units in 2022 (18.5% of all units):
This neighborhood: $672,838 Colorado: $526,340
- Average estimated value of housing units in 2-unit structures in 2022 (34.8% of all units):
This neighborhood: $876,095 Colorado: $431,509
- Average estimated '22 value of housing units in 5-or-more-unit structures (6.5% of all units):
Whittier: $436,853 Colorado: $417,586
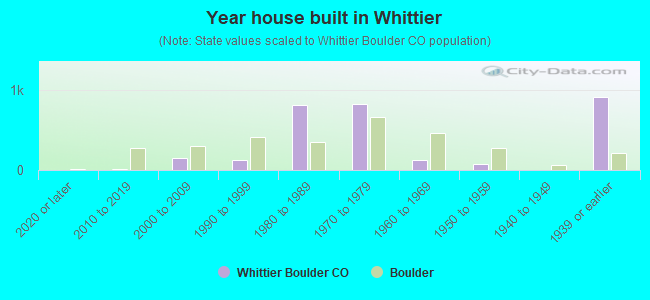
- Year house built in Whittier
- 142020 or later
- 142010 to 2019
- 1012000 to 2009
- 1921990 to 1999
- 1701980 to 1989
- 1381970 to 1979
- 3421960 to 1969
- 1971950 to 1959
- 631940 to 1949
- 1,6311939 or earlier
City-data.com crime index for city in 2020 (higher means more crime):
| City: | 519.0 |
| U.S. average: | 219.5 |
Travel time to work (commute)
![Travel time to work (commute)]()
- 22Less than 5 minutes
- 1085 to 9 minutes
- 27810 to 14 minutes
- 27215 to 19 minutes
- 18520 to 24 minutes
- 6625 to 29 minutes
- 14130 to 34 minutes
- 21735 to 39 minutes
- 6140 to 44 minutes
- 12745 to 59 minutes
- 4860 to 89 minutes
- 4290 or more minutes

Means of transportation to work
![Means of transportation to work]()
- 45.6%1,241Drove a car alone
- 5.6%152Carpooled
- 4.5%122Bus
- 2.5%67Subway or elevated rail
- 3.6%97Light rail, streetcar or trolley
- 0.4%11Taxi
- 0.5%14Motorcycle
- 10.5%285Bicycle
- 3.8%104Walked
- 4.3%118Other means
- 26.9%733Worked at home

Time leaving home to go to work
![Time leaving home to go to work]()
- 4312:00 a.m. to 4:59 a.m.
- 655:00 a.m. to 5:29 a.m.
- 145:30 a.m. to 5:59 a.m.
- 846:00 a.m. to 6:29 a.m.
- 1106:30 a.m. to 6:59 a.m.
- 1337:00 a.m. to 7:29 a.m.
- 2067:30 a.m. to 7:59 a.m.
- 3118:00 a.m. to 8:29 a.m.
- 1548:30 a.m. to 8:59 a.m.
- 1239:00 a.m. to 9:59 a.m.
- 1910:00 a.m. to 10:59 a.m.
- 1011:00 a.m. to 11:59 a.m.
- 7812:00 p.m. to 3:59 p.m.
- 1734:00 p.m. to 11:59 p.m.

Occupations of males:
- Percentage of males in management occupations (except farmers):
Here: 24.1% city: 15.4%
- Percentage of males in business and financial operations occupations:
Here: 11.4% city: 8.3%
- Percentage of males in computer and mathematical occupations:
Here: 6.4% city: 7.4%
- Percentage of males in architecture and engineering occupations:
Here: 1.8% city: 4.5%
- Percentage of males in community and social services occupations:
Here: 2.3% city: 0.9%
- Percentage of males in legal occupations:
Here: 4.1% city: 2.3%
- Percentage of males in education, training, and library occupations:
Here: 6.3% city: 3.1%
- Percentage of males in arts, design, entertainment, sports, and media occupations:
Here: 12.1% city: 3.1%
- Percentage of males in healthcare practitioners and technical occupations:
Here: 4.4% city: 3.5%
- Percentage of males in service occupations:
Here: 11.4% city: 11.9%
- Percentage of males in sales and office occupations:
Here: 7.3% city: 15.4%
- Percentage of males in construction, extraction, and maintenance occupations:
Here: 1.8% city: 8.0%
- Percentage of males in transportation occupations:
Here: 6.3% city: 4.2%
Occupations of females:
- Percentage of females in management occupations (except farmers):
Here: 27.8% city: 14.0%
- Percentage of females in business and financial operations occupations:
Here: 7.0% city: 10.0%
- Percentage of females in computer and mathematical occupations:
Here: 2.4% city: 2.9%
- Percentage of females in life, physical, and social science occupations:
Here: 3.4% city: 1.5%
- Percentage of females in legal occupations:
Here: 1.6% city: 2.4%
- Percentage of females in education, training, and library occupations:
Here: 7.3% city: 7.9%
- Percentage of females in arts, design, entertainment, sports, and media occupations:
Here: 9.7% city: 3.8%
- Percentage of females in healthcare practitioners and technical occupations:
Here: 9.4% city: 10.2%
- Percentage of females in service occupations:
Here: 15.5% city: 16.2%
- Percentage of females in sales and office occupations:
Here: 12.1% city: 21.4%
- Percentage of females in construction, extraction, and maintenance occupations:
Here: 1.7% city: 0.4%
- Percentage of females in production occupations:
Here: 1.8% city: 1.7%
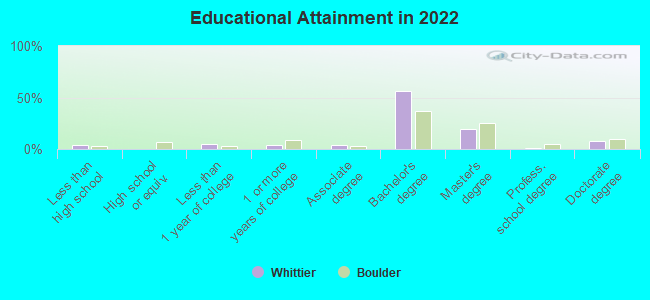
Education in this neighborhood (subdivision or community):
- Percentage of people 3 years and older in K-12 schools:
Whittier: 17.8% Denver: 12.7%
- Percentage of people 3 years and older in undergraduate colleges:
Whittier: 2.3% Denver: 4.1%
- Percentage of people 3 years and older in grad. or professional schools:
Whittier: 1.4% Denver: 2.2%
- Percentage of students K-12 enrolled in private schools:
Whittier: 38.6% Denver: 11.0%
Percentage of population below poverty level:
| Whittier: | 11.4% |
| Denver: | 11.8% |
Median year owner moved in (as recorded in 2022):
Median year renter moved in (as recorded in 2022):
| Whittier: | 2987 |
| Denver: | 2014 |
Median year renter moved in (as recorded in 2022):
| Whittier: | 2989 |
| Denver: | 2021 |
Percentage of married-couple families with both working:
| Whittier: | 96.2% |
| Denver: | 74.1% |
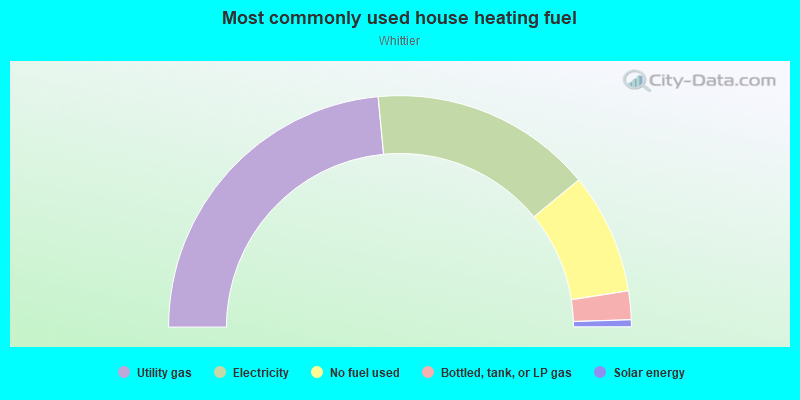
- 78.9%Utility gas
- 16.6%Electricity
- 2.4%Bottled, tank, or LP gas
- 1.7%Other fuel
Roads and streets:
Williams St
Length: 0.78 miles
Direction: N-S
Address range: 2300 to 3199
Direction: N-S
Address range: 2300 to 3199
Race St
Length: 0.78 miles
Direction: N-S
Address range: 2300 to 3199
Direction: N-S
Address range: 2300 to 3199
Gaylord St
Length: 0.78 miles
Direction: N-S
Address range: 2300 to 3199
Direction: N-S
Address range: 2300 to 3199
Vine St
Length: 0.78 miles
Direction: N-S
Address range: 2300 to 3199
Direction: N-S
Address range: 2300 to 3199
E 31st Ave
Length: 0.77 miles
Direction: E-W
Address range: 1300 to 2199
Direction: E-W
Address range: 1300 to 2199
E 29th Ave
Length: 0.77 miles
Direction: E-W
Address range: 1300 to 2199
Direction: E-W
Address range: 1300 to 2199
E 26th Ave
Length: 0.77 miles
Direction: E-W
Address range: 1300 to 2199
Direction: E-W
Address range: 1300 to 2199
E 25th Ave
Length: 0.77 miles
Direction: E-W
Address range: 1300 to 2199
Direction: E-W
Address range: 1300 to 2199
E 24th Ave
Length: 0.77 miles
Direction: E-W
Address range: 1300 to 2199
Direction: E-W
Address range: 1300 to 2199
E 23rd Ave
Length: 0.77 miles
Direction: E-W
Address range: 1300 to 2199
Direction: E-W
Address range: 1300 to 2199
Lafayette St
Length: 0.76 miles
Direction: N-S
Address range: 2300 to 3199
Direction: N-S
Address range: 2300 to 3199
High St
Length: 0.76 miles
Direction: N-S
Address range: 2300 to 3199
Direction: N-S
Address range: 2300 to 3199
Marion St
Length: 0.76 miles
Directions: N-S, SW-NE
Address range: 2300 to 3199
Directions: N-S, SW-NE
Address range: 2300 to 3199
Humboldt St
Length: 0.75 miles
Direction: N-S
Address range: 2300 to 3175
Direction: N-S
Address range: 2300 to 3175
E 28th Ave
Length: 0.69 miles
Direction: E-W
Address range: 1300 to 2199
Direction: E-W
Address range: 1300 to 2199
Martin Luther King Blvd (E Martin Luther King Blvd, E 32nd Ave)
Length: 0.68 miles
Direction: E-W
Address range: 1221 to 2199
Direction: E-W
Address range: 1221 to 2199
E 30th Ave
Length: 0.68 miles
Direction: E-W
Address range: 1300 to 2199
Direction: E-W
Address range: 1300 to 2199
E 27th Ave
Length: 0.61 miles
Direction: E-W
Address range: 1230 to 2199
Direction: E-W
Address range: 1230 to 2199
Franklin St
Length: 0.61 miles
Direction: N-S
Address range: 2300 to 3199
Direction: N-S
Address range: 2300 to 3199
Gilpin St
Length: 0.50 miles
Direction: N-S
Address range: 2300 to 3155
Direction: N-S
Address range: 2300 to 3155