Whitburn Estates neighborhood in Midland, Texas (TX), 79705 detailed profile
Settings
X


Business Search - 14 Million verified businesses
Area: 0.069 square miles
Population: 503
Population density:
| Whitburn Estates: | 7,333 people per square mile |
| Midland: | 2,018 people per square mile |

- 36368.9%White
- 14026.6%Hispanic or Latino
- 132.5%Black
- 101.9%Two or more races
- 10.2%Asian

Median household income in 2022:
| Whitburn Estates: | $120,565 |
| Midland: | $80,235 |
Distribution of median household income
![Distribution of median household income]()
- 19Less than $10,000
- 6$10,000 to $19,999
- 17$20,000 to $29,999
- 7$30,000 to $39,999
- 18$40,000 to $49,999
- 5$50,000 to $59,999
- 10$60,000 to $74,999
- 27$75,000 to $99,999
- 44$100,000 to $124,999
- 71$125,000 to $149,999
- 37$150,000 to $199,999
- 39$200,000 or more

Distribution of owner-occupied house/condo value
![Distribution of owner-occupied house/condo value]()
- 22Less than $50,000
- 4$50,000 to $99,999
- 2$100,000 to $149,999
- 7$150,000 to $199,999
- 9$200,000 to $249,999
- 14$250,000 to $299,999
- 44$300,000 to $399,999
- 45$400,000 to $499,999
- 7$500,000 to $749,999
- 3$1,000,000 or more

Distribution of rent paid by renters
![Distribution of rent paid by renters]()
- 4$300 to $399
- 3$400 to $499
- 1$600 to $699
- 7$700 to $799
- 13$800 to $899
- 8$900 to $999
- 27$1,000 to $1,249
- 44$1,250 to $1,499
- 11$1,500 to $1,999
- 81$2,000 or more

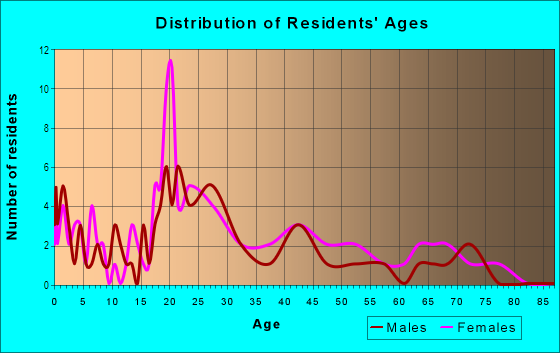
| Males: | 284 |
| Females: | 219 |
Males:
| This neighborhood: | 40.6 years |
| Whole city: | 32.3 years |
| This neighborhood: | 40.7 years |
| Whole city: | 33.3 years |
Average household size:
| Whitburn Estates: | 12.8 people |
| Midland: | 2.4 people |
Percentage of family households:
| Whitburn Estates: | 51.4% |
| Midland: | 52.0% |
| Here: | 52.5% |
| Midland: | 46.4% |
Percentage of married-couple families with children (among all households):
| Whitburn Estates: | 48.2% |
| Midland: | 30.9% |
Percentage of single-mother households (among all households):
| Whitburn Estates: | 0.0% |
| Midland: | 8.1% |
Percentage of never married males 15 years old and over:
Percentage of never married females 15 years old and over:
| Whitburn Estates: | 18.4% |
| Midland: | 15.2% |
Percentage of never married females 15 years old and over:
| Whitburn Estates: | 6.4% |
| city: | 14.9% |
Percentage of people that speak English not well or not at all:
| Whitburn Estates: | 2.5% |
| Midland: | 5.7% |
Percentage of people born in this state:
Percentage of people born in another U.S. state:
Percentage of native residents but born outside the U.S.:
Percentage of foreign born residents:
| Here: | 70.6% |
| Midland: | 69.5% |
Percentage of people born in another U.S. state:
| Whitburn Estates: | 24.5% |
| Midland: | 18.2% |
Percentage of native residents but born outside the U.S.:
| Here: | 0.3% |
| city: | 1.2% |
Percentage of foreign born residents:
| Here: | 4.9% |
| Midland: | 11.2% |

Owner-occupied
Renter-occupied


- Rooms in owner-occupied houses and condos in Whitburn Estates
- 01 room
- 02 rooms
- 03 rooms
- 24 rooms
- 165 rooms
- 96 rooms
- 57 rooms
- 158 rooms
- 739+ rooms

- Rooms in renter-occupied apartments in Whitburn Estates
- 181 room
- 242 rooms
- 333 rooms
- 144 rooms
- 125 rooms
- 66 rooms
- 397 rooms
- 38 rooms
- 369+ rooms
Owner-occupied
Renter-occupied

- Bedrooms in owner-occupied houses and condos in Whitburn Estates
- 0no bedroom
- 01 bedroom
- 122 bedrooms
- 203 bedrooms
- 774 bedrooms
- 125+ bedrooms

- Bedrooms in renter-occupied apartments in Whitburn Estates
- 18no bedroom
- 71 bedroom
- 332 bedrooms
- 763 bedrooms
- 44 bedrooms
- 05+ bedrooms
Average number of cars or other vehicles available in houses/condos:
Average number of cars or other vehicles available in apartments:
| This neighborhood: | 2.5 |
| Midland: | 2.1 |
Average number of cars or other vehicles available in apartments:
| Here: | |
| city: |
Percentage of units with a mortgage:
| Whitburn Estates: | 63.3% |
| Midland: | 58.2% |
Average estimated value of detached houses in 2022 (60.7% of all units):
| Whitburn Estates: | $348,911 |
| Texas: | $369,058 |

- Year house built in Whitburn Estates
- 02020 or later
- 92010 to 2019
- 262000 to 2009
- 221990 to 1999
- 831980 to 1989
- 1161970 to 1979
- 111960 to 1969
- 71950 to 1959
- 01940 to 1949
- 01939 or earlier

City-data.com crime index for city in 2020 (higher means more crime):
| City: | 223.8 |
| U.S. average: | 219.5 |
Travel time to work (commute)
![Travel time to work (commute)]()
- 9Less than 5 minutes
- 525 to 9 minutes
- 7010 to 14 minutes
- 8115 to 19 minutes
- 5520 to 24 minutes
- 2025 to 29 minutes
- 2430 to 34 minutes
- 135 to 39 minutes
- 340 to 44 minutes
- 3045 to 59 minutes
- 660 to 89 minutes
- 890 or more minutes

Means of transportation to work
![Means of transportation to work]()
- 82.5%259Drove a car alone
- 14.7%46Carpooled
- 3.8%12Bicycle
- 0.3%1Walked
- 2.2%7Worked at home

Time leaving home to go to work
![Time leaving home to go to work]()
- 2512:00 a.m. to 4:59 a.m.
- 45:00 a.m. to 5:29 a.m.
- 205:30 a.m. to 5:59 a.m.
- 696:00 a.m. to 6:29 a.m.
- 216:30 a.m. to 6:59 a.m.
- 597:00 a.m. to 7:29 a.m.
- 827:30 a.m. to 7:59 a.m.
- 238:00 a.m. to 8:29 a.m.
- 148:30 a.m. to 8:59 a.m.
- 29:00 a.m. to 9:59 a.m.
- 710:00 a.m. to 10:59 a.m.
- 611:00 a.m. to 11:59 a.m.
- 612:00 p.m. to 3:59 p.m.
- 24:00 p.m. to 11:59 p.m.

Occupations of males:
- Percentage of males in management occupations (except farmers):
Here: 11.2% city: 14.6%
- Percentage of males in architecture and engineering occupations:
Here: 10.2% city: 7.5%
- Percentage of males in life, physical, and social science occupations:
Here: 16.1% city: 1.9%
- Percentage of males in education, training, and library occupations:
Here: 3.7% city: 2.5%
- Percentage of males in service occupations:
Here: 14.5% city: 9.5%
- Percentage of males in sales and office occupations:
Here: 4.0% city: 14.8%
- Percentage of males in construction, extraction, and maintenance occupations:
Here: 2.7% city: 15.1%
- Percentage of males in production occupations:
Here: 18.5% city: 7.5%
- Percentage of males in transportation occupations:
Here: 2.4% city: 5.1%
- Percentage of males in material moving occupations:
Here: 5.7% city: 4.8%
Occupations of females:
- Percentage of females in management occupations (except farmers):
Here: 15.9% city: 11.6%
- Percentage of females in community and social services occupations:
Here: 3.3% city: 1.7%
- Percentage of females in education, training, and library occupations:
Here: 20.5% city: 11.2%
- Percentage of females in arts, design, entertainment, sports, and media occupations:
Here: 6.9% city: 1.7%
- Percentage of females in healthcare practitioners and technical occupations:
Here: 24.8% city: 6.8%
- Percentage of females in sales and office occupations:
Here: 16.0% city: 33.2%
- Percentage of females in construction, extraction, and maintenance occupations:
Here: 11.1% city: 0.6%
- Percentage of females in production occupations:
Here: 4.6% city: 2.0%
Education in this neighborhood (subdivision or community):
- Percentage of people 3 years and older in K-12 schools:
Whitburn Estates: 16.7% Midland: 22.4%
- Percentage of people 3 years and older in undergraduate colleges:
Whitburn Estates: 3.4% Midland: 3.0%
- Percentage of people 3 years and older in grad. or professional schools:
Whitburn Estates: 0.6% Midland: 1.8%
- Percentage of students K-12 enrolled in private schools:
Whitburn Estates: 27.4% Midland: 16.2%
Percentage of population below poverty level:
| Whitburn Estates: | 8.4% |
| Midland: | 11.7% |
Median year owner moved in (as recorded in 2022):
| Whitburn Estates: | 2006 |
| Midland: | 2015 |
Percentage of married-couple families with both working:
| Whitburn Estates: | 84.1% |
| Midland: | 63.2% |

- 50.5%Electricity
- 41.1%Utility gas
- 8.4%Bottled, tank, or LP gas