Westerwood neighborhood in Greensboro, North Carolina (NC), 27401, 27403 detailed profile
Settings
X


Business Search - 14 Million verified businesses
Area: 0.311 square miles
Population: 1,078
Population density:
| Westerwood: | 3,462 people per square mile |
| Greensboro: | 2,876 people per square mile |

- 87180.7%White
- 11210.4%Black
- 383.5%Asian
- 262.4%Hispanic or Latino
- 252.3%Two or more races
- 70.6%Some other race

Median household income in 2022:
| Westerwood: | $67,586 |
| Greensboro: | $55,120 |
Distribution of median household income
![Distribution of median household income]()
- 24Less than $10,000
- 45$10,000 to $19,999
- 56$20,000 to $29,999
- 21$30,000 to $39,999
- 71$40,000 to $49,999
- 18$50,000 to $59,999
- 47$60,000 to $74,999
- 59$75,000 to $99,999
- 78$100,000 to $124,999
- 30$125,000 to $149,999
- 45$150,000 to $199,999
- 28$200,000 or more

Distribution of owner-occupied house/condo value
![Distribution of owner-occupied house/condo value]()
- 13$50,000 to $99,999
- 29$100,000 to $149,999
- 14$150,000 to $199,999
- 66$200,000 to $249,999
- 28$250,000 to $299,999
- 84$300,000 to $399,999
- 19$400,000 to $499,999
- 18$500,000 to $749,999
- 6$750,000 to $999,999
- 7$1,000,000 or more

Distribution of rent paid by renters
![Distribution of rent paid by renters]()
- 9$100 to $199
- 11$300 to $399
- 3$400 to $499
- 45$500 to $599
- 48$600 to $699
- 32$700 to $799
- 41$800 to $899
- 40$900 to $999
- 55$1,000 to $1,249
- 22$1,250 to $1,499
- 10$1,500 to $1,999

Median rent in 2022:
| Westerwood: | $871 |
| Greensboro: | $915 |
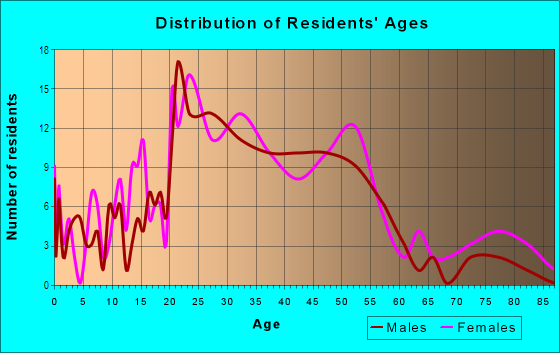
| Males: | 610 |
| Females: | 468 |
Males:
| This neighborhood: | 31.7 years |
| Whole city: | 32.4 years |
| This neighborhood: | 35.3 years |
| Whole city: | 35.3 years |
Average household size:
| Westerwood: | 11.7 people |
| Greensboro: | 2.3 people |
Percentage of family households:
| Westerwood: | 29.8% |
| Greensboro: | 43.6% |
| Here: | 39.7% |
| Greensboro: | 36.2% |
Percentage of married-couple families with children (among all households):
| Westerwood: | 34.3% |
| Greensboro: | 22.4% |
Percentage of single-mother households (among all households):
| Westerwood: | 21.4% |
| Greensboro: | 15.5% |
Percentage of never married males 15 years old and over:
Percentage of never married females 15 years old and over:
| Westerwood: | 27.8% |
| Greensboro: | 20.8% |
Percentage of never married females 15 years old and over:
| Westerwood: | 16.4% |
| city: | 23.9% |
Percentage of people that speak English not well or not at all:
| Westerwood: | 0.6% |
| Greensboro: | 2.7% |
Percentage of people born in this state:
Percentage of people born in another U.S. state:
Percentage of native residents but born outside the U.S.:
Percentage of foreign born residents:
| Here: | 48.9% |
| Greensboro: | 52.7% |
Percentage of people born in another U.S. state:
| Westerwood: | 41.8% |
| Greensboro: | 33.7% |
Percentage of native residents but born outside the U.S.:
| Here: | 1.9% |
| city: | 1.6% |
Percentage of foreign born residents:
| Here: | 7.4% |
| Greensboro: | 12.0% |

Owner-occupied
Renter-occupied


- Rooms in owner-occupied houses and condos in Westerwood
- 01 room
- 02 rooms
- 43 rooms
- 224 rooms
- 235 rooms
- 366 rooms
- 847 rooms
- 288 rooms
- 579+ rooms

- Rooms in renter-occupied apartments in Westerwood
- 381 room
- 232 rooms
- 373 rooms
- 604 rooms
- 595 rooms
- 86 rooms
- 117 rooms
- 08 rooms
- 349+ rooms
Owner-occupied
Renter-occupied

- Bedrooms in owner-occupied houses and condos in Westerwood
- 0no bedroom
- 01 bedroom
- 342 bedrooms
- 1363 bedrooms
- 624 bedrooms
- 55+ bedrooms

- Bedrooms in renter-occupied apartments in Westerwood
- 41no bedroom
- 751 bedroom
- 842 bedrooms
- 463 bedrooms
- 64 bedrooms
- 05+ bedrooms
Average number of cars or other vehicles available in houses/condos:
Average number of cars or other vehicles available in apartments:
| This neighborhood: | 1.6 |
| Greensboro: | 2.0 |
Average number of cars or other vehicles available in apartments:
| Here: | 1.3 |
| city: | 1.4 |
Percentage of units with a mortgage:
| Westerwood: | 64.1% |
| Greensboro: | 67.4% |
Average estimated value of detached houses in 2022 (52.3% of all units):
| Westerwood: | $291,378 |
| Greensboro: | $297,193 |

- Year house built in Westerwood
- 02020 or later
- 122010 to 2019
- 132000 to 2009
- 171990 to 1999
- 421980 to 1989
- 411970 to 1979
- 221960 to 1969
- 1141950 to 1959
- 571940 to 1949
- 2821939 or earlier

City-data.com crime index for city in 2020 (higher means more crime):
| City: | 435.6 |
| U.S. average: | 219.5 |
Travel time to work (commute)
![Travel time to work (commute)]()
- 31Less than 5 minutes
- 1485 to 9 minutes
- 9910 to 14 minutes
- 10015 to 19 minutes
- 7720 to 24 minutes
- 525 to 29 minutes
- 3330 to 34 minutes
- 1135 to 39 minutes
- 1840 to 44 minutes
- 4245 to 59 minutes
- 2260 to 89 minutes
- 690 or more minutes

Means of transportation to work
![Means of transportation to work]()
- 64.9%419Drove a car alone
- 2.5%16Carpooled
- 2.9%19Bus
- 1.4%9Taxi
- 0.5%3Motorcycle
- 5.7%37Bicycle
- 14.9%96Walked
- 0.9%6Other means
- 12.1%78Worked at home

Time leaving home to go to work
![Time leaving home to go to work]()
- 512:00 a.m. to 4:59 a.m.
- 25:00 a.m. to 5:29 a.m.
- 205:30 a.m. to 5:59 a.m.
- 96:00 a.m. to 6:29 a.m.
- 106:30 a.m. to 6:59 a.m.
- 577:00 a.m. to 7:29 a.m.
- 877:30 a.m. to 7:59 a.m.
- 868:00 a.m. to 8:29 a.m.
- 1158:30 a.m. to 8:59 a.m.
- 1029:00 a.m. to 9:59 a.m.
- 110:00 a.m. to 10:59 a.m.
- 711:00 a.m. to 11:59 a.m.
- 3412:00 p.m. to 3:59 p.m.
- 434:00 p.m. to 11:59 p.m.

Occupations of males:
- Percentage of males in management occupations (except farmers):
Here: 17.3% city: 10.2%
- Percentage of males in business and financial operations occupations:
Here: 4.6% city: 4.8%
- Percentage of males in computer and mathematical occupations:
Here: 5.6% city: 3.9%
- Percentage of males in architecture and engineering occupations:
Here: 1.4% city: 3.1%
- Percentage of males in community and social services occupations:
Here: 1.2% city: 1.4%
- Percentage of males in legal occupations:
Here: 1.5% city: 0.8%
- Percentage of males in education, training, and library occupations:
Here: 11.7% city: 4.0%
- Percentage of males in arts, design, entertainment, sports, and media occupations:
Here: 7.9% city: 1.5%
- Percentage of males in healthcare practitioners and technical occupations:
Here: 1.5% city: 3.1%
- Percentage of males in service occupations:
Here: 11.0% city: 14.3%
- Percentage of males in sales and office occupations:
Here: 18.9% city: 17.1%
- Percentage of males in construction, extraction, and maintenance occupations:
Here: 5.3% city: 6.0%
- Percentage of males in production occupations:
Here: 1.3% city: 7.5%
- Percentage of males in transportation occupations:
Here: 9.8% city: 6.8%
Occupations of females:
- Percentage of females in management occupations (except farmers):
Here: 5.1% city: 7.8%
- Percentage of females in business and financial operations occupations:
Here: 2.6% city: 5.5%
- Percentage of females in computer and mathematical occupations:
Here: 10.8% city: 2.1%
- Percentage of females in life, physical, and social science occupations:
Here: 2.3% city: 1.0%
- Percentage of females in community and social services occupations:
Here: 2.0% city: 3.2%
- Percentage of females in education, training, and library occupations:
Here: 17.8% city: 10.3%
- Percentage of females in arts, design, entertainment, sports, and media occupations:
Here: 5.6% city: 1.8%
- Percentage of females in healthcare practitioners and technical occupations:
Here: 14.1% city: 8.6%
- Percentage of females in service occupations:
Here: 4.9% city: 19.4%
- Percentage of females in sales and office occupations:
Here: 32.5% city: 29.0%
- Percentage of females in material moving occupations:
Here: 1.7% city: 2.7%
Education in this neighborhood (subdivision or community):
- Percentage of people 3 years and older in K-12 schools:
Westerwood: 12.1% Greensboro: 17.6%
- Percentage of people 3 years and older in undergraduate colleges:
Westerwood: 14.8% Greensboro: 11.2%
- Percentage of people 3 years and older in grad. or professional schools:
Westerwood: 3.7% Greensboro: 2.6%
- Percentage of students K-12 enrolled in private schools:
Westerwood: 18.6% Greensboro: 13.3%
Percentage of population below poverty level:
| Westerwood: | 13.0% |
| Greensboro: | 21.9% |
Median year owner moved in (as recorded in 2022):
Median year renter moved in (as recorded in 2022):
| Westerwood: | 2004 |
| Greensboro: | 2010 |
Median year renter moved in (as recorded in 2022):
| Westerwood: | 2016 |
| Greensboro: | 2020 |
Percentage of married-couple families with both working:
| Westerwood: | 110.0% |
| Greensboro: | 70.9% |

- 50.5%Utility gas
- 34.7%Electricity
- 8.8%Fuel oil, kerosene, etc.
- 3.7%Bottled, tank, or LP gas
- 1.6%No fuel used
- 0.7%Wood
Roads and streets:
Fairmont St
Length: 0.87 miles
Directions: E-W, SE-NW, SW-NE
Address range: 100 to 1599
Directions: E-W, SE-NW, SW-NE
Address range: 100 to 1599
W Friendly Ave
Length: 0.82 miles
Direction: E-W
Address range: 812 to 1599
Direction: E-W
Address range: 812 to 1599
E Lake Dr
Length: 0.70 miles
Directions: E-W, N-S, SE-NW, SW-NE
Address range: 200 to 899
Directions: E-W, N-S, SE-NW, SW-NE
Address range: 200 to 899
Guilford Ave
Length: 0.56 miles
Direction: E-W
Address range: 507 to 1099
Direction: E-W
Address range: 507 to 1099
Courtland St
Length: 0.48 miles
Directions: E-W, SE-NW
Address range: 100 to 1099
Directions: E-W, SE-NW
Address range: 100 to 1099
Mimosa Dr
Length: 0.48 miles
Directions: E-W, N-S, SE-NW
Address range: 200 to 1599
Directions: E-W, N-S, SE-NW
Address range: 200 to 1599
N Mendenhall St
Length: 0.47 miles
Directions: N-S, SE-NW
Address range: 200 to 699
Directions: N-S, SE-NW
Address range: 200 to 699
Woodlawn Ave
Length: 0.36 miles
Direction: N-S
Address range: 100 to 599
Direction: N-S
Address range: 100 to 599
Hillside Dr
Length: 0.29 miles
Directions: N-S, SE-NW
Address range: 100 to 603
Directions: N-S, SE-NW
Address range: 100 to 603
Northfield St
Length: 0.29 miles
Direction: E-W
Address range: 1300 to 1599
Direction: E-W
Address range: 1300 to 1599
Westover Ter
Length: 0.27 miles
Direction: N-S
Address range: 200 to 499
Direction: N-S
Address range: 200 to 499
Hillcrest Dr
Length: 0.26 miles
Direction: N-S
Address range: 200 to 499
Direction: N-S
Address range: 200 to 499
Aberdeen Ter
Length: 0.25 miles
Direction: N-S
Address range: 200 to 499
Direction: N-S
Address range: 200 to 499
Crestland Ave
Length: 0.25 miles
Direction: N-S
Address range: 100 to 498
Direction: N-S
Address range: 100 to 498
Lakeview St
Length: 0.24 miles
Direction: E-W
Address range: 100 to 999
Direction: E-W
Address range: 100 to 999
Adams St
Length: 0.23 miles
Direction: N-S
Address range: 200 to 598
Direction: N-S
Address range: 200 to 598
Hampton St
Length: 0.13 miles
Direction: E-W
Address range: 1000 to 1199
Direction: E-W
Address range: 1000 to 1199
Wilson St
Length: 0.11 miles
Direction: N-S
Address range: 200 to 299
Direction: N-S
Address range: 200 to 299
Hunt St
Length: 0.08 miles
Direction: E-W
Address range: 800 to 899
Direction: E-W
Address range: 800 to 899
Fountain St
Length: 0.06 miles
Direction: N-S
Address range: 100 to 699
Direction: N-S
Address range: 100 to 699
Garland Dr
Length: 0.06 miles
Directions: N-S, SE-NW
Address range: 1100 to 1199
Directions: N-S, SE-NW
Address range: 1100 to 1199
Other features:
N Buffalo Crk
Length: 0.35 miles
Directions: N-S, SE-NW, SW-NE
Directions: N-S, SE-NW, SW-NE