Waverly Square neighborhood in Belmont, Massachusetts (MA), 02478 detailed profile
Settings
X


Business Search - 14 Million verified businesses
Area: 0.035 square miles
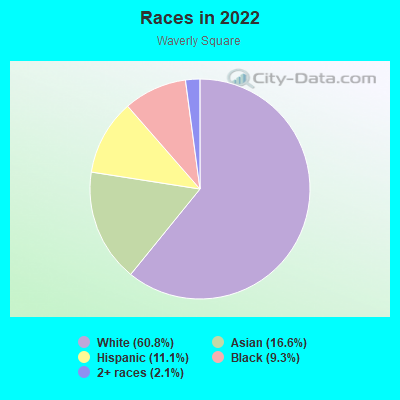
Population: 331
Population density:
| Waverly Square: | 9,539 people per square mile |
| Belmont: | 5,792 people per square mile |

- 20260.8%White
- 5516.6%Asian
- 3711.1%Hispanic or Latino
- 319.3%Black
- 72.1%Two or more races
Median household income in 2022:
| Waverly Square: | $111,973 |
| Belmont: | $164,918 |
Distribution of median household income
![Distribution of median household income]()
- 6Less than $10,000
- 13$10,000 to $19,999
- 25$20,000 to $29,999
- 5$30,000 to $39,999
- 4$40,000 to $49,999
- 8$50,000 to $59,999
- 18$60,000 to $74,999
- 9$75,000 to $99,999
- 6$100,000 to $124,999
- 17$125,000 to $149,999
- 21$150,000 to $199,999
- 30$200,000 or more

Distribution of owner-occupied house/condo value
![Distribution of owner-occupied house/condo value]()
- 1Less than $50,000
- 1$100,000 to $149,999
- 4$300,000 to $399,999
- 7$400,000 to $499,999
- 27$500,000 to $749,999
- 32$750,000 to $999,999
- 24$1,000,000 or more

Distribution of rent paid by renters
![Distribution of rent paid by renters]()
- 12Less than $100
- 4$100 to $199
- 6$200 to $299
- 3$300 to $399
- 1$400 to $499
- 4$600 to $699
- 2$700 to $799
- 1$1,000 to $1,249
- 1$1,250 to $1,499
- 12$1,500 to $1,999
- 44$2,000 or more

Median rent in 2022:
| Waverly Square: | $2,201 |
| Belmont: | $2,001 |
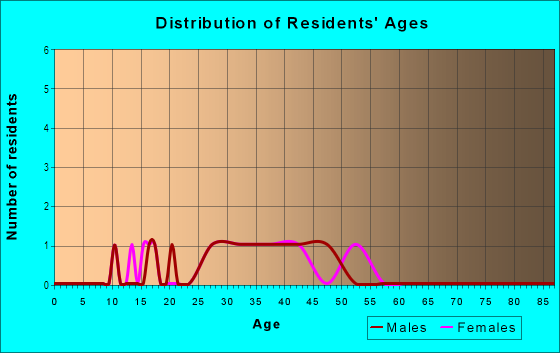
| Males: | 153 |
| Females: | 178 |
Males:
| This neighborhood: | 44.2 years |
| Whole city: | 41.7 years |
| This neighborhood: | 50.1 years |
| Whole city: | 42.3 years |
Average household size:
| Waverly Square: | 2.2 people |
| Belmont: | 2.6 people |
Percentage of family households:
| Waverly Square: | 40.7% |
| Belmont: | 52.9% |
| Here: | 52.3% |
| Belmont: | 62.9% |
Percentage of married-couple families with children (among all households):
| Waverly Square: | 35.4% |
| Belmont: | 34.7% |
Percentage of single-mother households (among all households):
| Waverly Square: | 3.1% |
| Belmont: | 2.8% |
Percentage of never married males 15 years old and over:
Percentage of never married females 15 years old and over:
| Waverly Square: | 10.9% |
| Belmont: | 11.9% |
Percentage of never married females 15 years old and over:
| Waverly Square: | 10.6% |
| place: | 13.4% |
Percentage of people that speak English not well or not at all:
| Waverly Square: | 3.1% |
| Belmont: | 3.0% |
Percentage of people born in this state:
Percentage of people born in another U.S. state:
Percentage of native residents but born outside the U.S.:
Percentage of foreign born residents:
| Here: | 46.5% |
| Belmont: | 44.8% |
Percentage of people born in another U.S. state:
| Waverly Square: | 19.9% |
| Belmont: | 27.9% |
Percentage of native residents but born outside the U.S.:
| Here: | 1.9% |
| place: | 1.7% |
Percentage of foreign born residents:
| Here: | 31.7% |
| Belmont: | 25.6% |
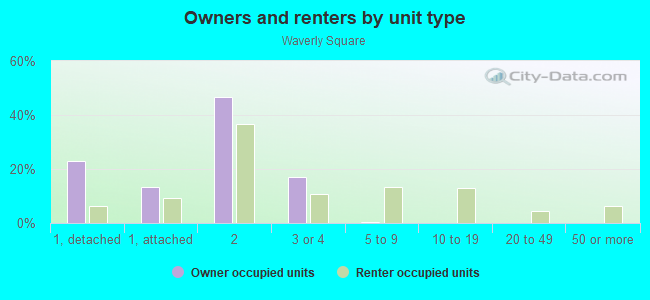
Owner-occupied
Renter-occupied

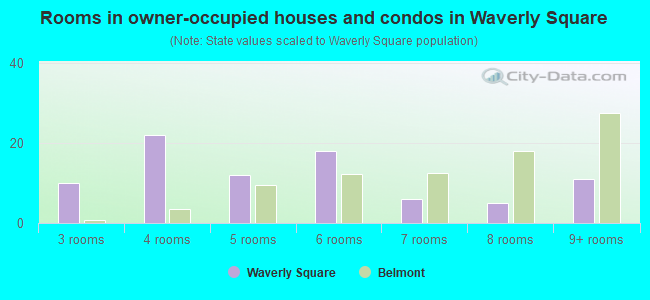
- Rooms in owner-occupied houses and condos in Waverly Square
- 01 room
- 02 rooms
- 103 rooms
- 224 rooms
- 125 rooms
- 186 rooms
- 67 rooms
- 58 rooms
- 119+ rooms
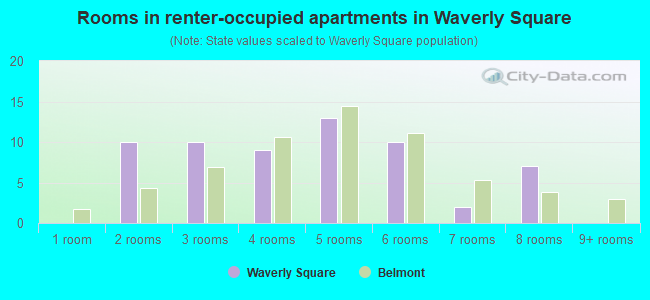
- Rooms in renter-occupied apartments in Waverly Square
- 01 room
- 102 rooms
- 103 rooms
- 94 rooms
- 135 rooms
- 106 rooms
- 27 rooms
- 78 rooms
- 09+ rooms
Owner-occupied
Renter-occupied
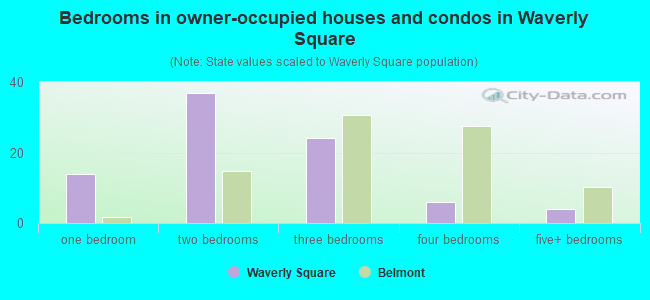
- Bedrooms in owner-occupied houses and condos in Waverly Square
- 0no bedroom
- 141 bedroom
- 372 bedrooms
- 243 bedrooms
- 64 bedrooms
- 45+ bedrooms
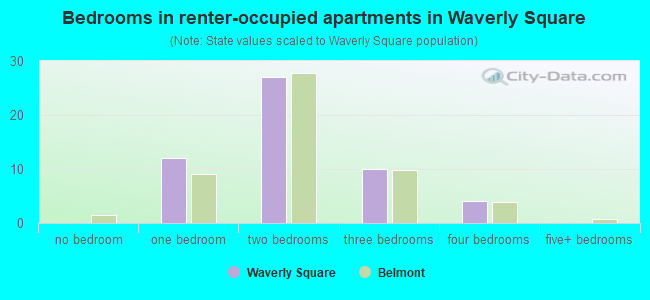
- Bedrooms in renter-occupied apartments in Waverly Square
- 0no bedroom
- 121 bedroom
- 272 bedrooms
- 103 bedrooms
- 44 bedrooms
- 05+ bedrooms
Average number of cars or other vehicles available in houses/condos:
Average number of cars or other vehicles available in apartments:
| This neighborhood: | 1.4 |
| Belmont: | 1.8 |
Average number of cars or other vehicles available in apartments:
| Here: | 0.9 |
| place: | 1.2 |
Percentage of units with a mortgage:
| Waverly Square: | 84.7% |
| Belmont: | 64.8% |
Housing prices:
- Average estimated value of detached houses in 2022 (18.8% of all units):
Waverly Square: $912,424 Belmont: $1,353,493
- Average estimated value of townhouses or other attached units in 2022 (11.9% of all units):
This neighborhood: $1,046,480 place: $1,035,480
- Average estimated value of housing units in 2-unit structures in 2022 (43.8% of all units):
This neighborhood: $825,341 Belmont: $774,009
- Average estimated '22 value of housing units in 3-to-4-unit structures (13.1% of all units):
Waverly Square: $565,727 place: $699,413
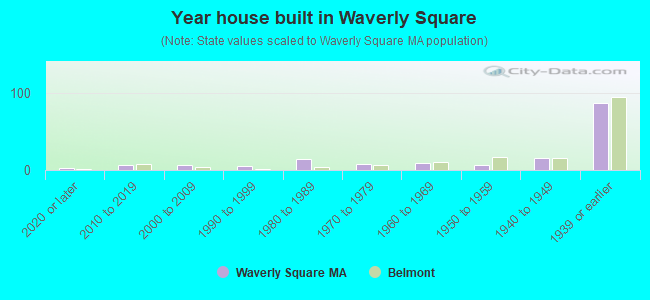
- Year house built in Waverly Square
- 22020 or later
- 72010 to 2019
- 72000 to 2009
- 51990 to 1999
- 141980 to 1989
- 81970 to 1979
- 91960 to 1969
- 71950 to 1959
- 161940 to 1949
- 871939 or earlier
City-data.com crime index for place in 2020 (higher means more crime):
| City: | 56.5 |
| U.S. average: | 219.5 |
Travel time to work (commute)
![Travel time to work (commute)]()
- 75 to 9 minutes
- 610 to 14 minutes
- 1315 to 19 minutes
- 1320 to 24 minutes
- 925 to 29 minutes
- 1730 to 34 minutes
- 1135 to 39 minutes
- 340 to 44 minutes
- 2745 to 59 minutes
- 760 to 89 minutes

Means of transportation to work
![Means of transportation to work]()
- 52.5%82Drove a car alone
- 7.0%11Carpooled
- 3.8%6Bus
- 14.1%22Subway or elevated rail
- 10.2%16Long-distance train or commuter rail
- 1.3%2Bicycle
- 1.3%2Other means
- 10.9%17Worked at home

Time leaving home to go to work
![Time leaving home to go to work]()
- 25:30 a.m. to 5:59 a.m.
- 46:00 a.m. to 6:29 a.m.
- 56:30 a.m. to 6:59 a.m.
- 117:00 a.m. to 7:29 a.m.
- 257:30 a.m. to 7:59 a.m.
- 178:00 a.m. to 8:29 a.m.
- 158:30 a.m. to 8:59 a.m.
- 129:00 a.m. to 9:59 a.m.
- 410:00 a.m. to 10:59 a.m.
- 211:00 a.m. to 11:59 a.m.
- 612:00 p.m. to 3:59 p.m.
- 24:00 p.m. to 11:59 p.m.

Occupations of males:
- Percentage of males in management occupations (except farmers):
Here: 15.6% place: 18.9%
- Percentage of males in business and financial operations occupations:
Here: 15.9% place: 9.8%
- Percentage of males in computer and mathematical occupations:
Here: 9.7% place: 11.9%
- Percentage of males in architecture and engineering occupations:
Here: 1.4% place: 7.3%
- Percentage of males in life, physical, and social science occupations:
Here: 10.3% place: 10.3%
- Percentage of males in community and social services occupations:
Here: 2.7% place: 0.9%
- Percentage of males in legal occupations:
Here: 5.2% place: 3.8%
- Percentage of males in healthcare practitioners and technical occupations:
Here: 3.6% place: 3.7%
- Percentage of males in service occupations:
Here: 1.4% place: 4.7%
- Percentage of males in sales and office occupations:
Here: 14.5% place: 10.1%
- Percentage of males in construction, extraction, and maintenance occupations:
Here: 2.5% place: 2.9%
- Percentage of males in production occupations:
Here: 3.8% place: 1.8%
Occupations of females:
- Percentage of females in management occupations (except farmers):
Here: 9.8% place: 16.9%
- Percentage of females in business and financial operations occupations:
Here: 13.9% place: 12.5%
- Percentage of females in life, physical, and social science occupations:
Here: 15.2% place: 7.8%
- Percentage of females in education, training, and library occupations:
Here: 15.4% place: 15.1%
- Percentage of females in arts, design, entertainment, sports, and media occupations:
Here: 9.8% place: 4.2%
- Percentage of females in healthcare practitioners and technical occupations:
Here: 2.1% place: 7.7%
- Percentage of females in service occupations:
Here: 6.7% place: 6.5%
- Percentage of females in sales and office occupations:
Here: 23.5% place: 17.8%
- Percentage of females in production occupations:
Here: 2.0% place: 0.6%
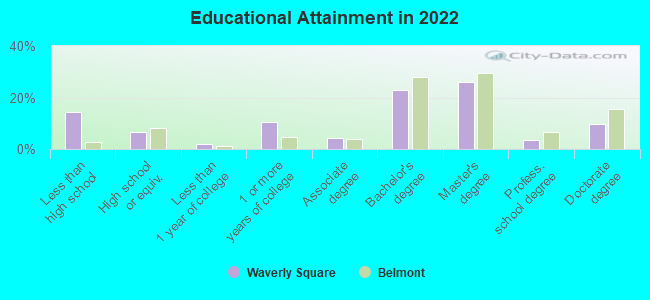
Education in this neighborhood (subdivision or community):
- Percentage of people 3 years and older in K-12 schools:
Waverly Square: 28.0% Belmont: 19.8%
- Percentage of people 3 years and older in undergraduate colleges:
Waverly Square: 1.2% Belmont: 3.9%
- Percentage of people 3 years and older in grad. or professional schools:
Waverly Square: 4.6% Belmont: 2.7%
- Percentage of students K-12 enrolled in private schools:
Waverly Square: 13.0% Belmont: 11.4%
Percentage of population below poverty level:
| Waverly Square: | 8.1% |
| Belmont: | 3.9% |
Median year owner moved in (as recorded in 2022):
Median year renter moved in (as recorded in 2022):
| Waverly Square: | 2010 |
| Belmont: | 2005 |
Median year renter moved in (as recorded in 2022):
| Waverly Square: | 2013 |
| Belmont: | 2016 |
Percentage of married-couple families with both working:
| Waverly Square: | 84.3% |
| Belmont: | 74.6% |
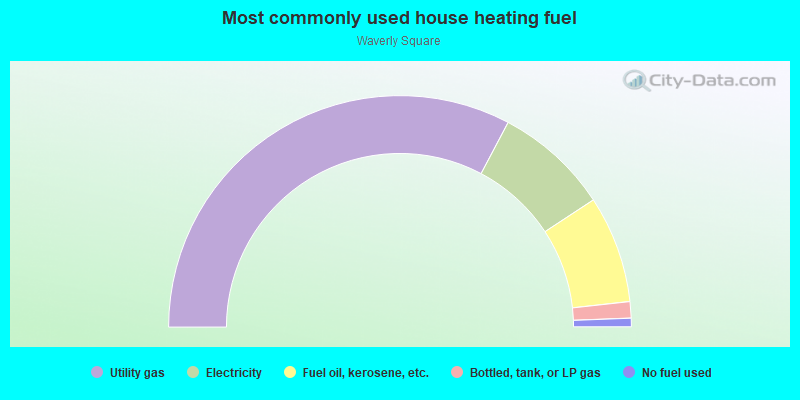
- 65.5%Utility gas
- 16.0%Electricity
- 15.0%Fuel oil, kerosene, etc.
- 2.3%Bottled, tank, or LP gas
- 1.2%No fuel used
Highways in this neighborhood:
Pleasant St (State Hwy 60)
Length: 0.05 miles
Direction: E-W
Address range: 1082 to 1099
Direction: E-W
Address range: 1082 to 1099
Roads and streets:
Trapelo Rd
Length: 0.35 miles
Directions: E-W, SE-NW
Address range: 442 to 566
Directions: E-W, SE-NW
Address range: 442 to 566
Thayer St
Length: 0.16 miles
Direction: E-W
Address range: 1 to 99
Direction: E-W
Address range: 1 to 99
Lexington St
Length: 0.12 miles
Directions: N-S, SE-NW
Address range: 1 to 49
Directions: N-S, SE-NW
Address range: 1 to 49
White St
Length: 0.11 miles
Directions: N-S, SW-NE
Address range: 1 to 66
Directions: N-S, SW-NE
Address range: 1 to 66
Church St
Length: 0.10 miles
Directions: E-W, SW-NE
Address range: 1 to 99
Directions: E-W, SW-NE
Address range: 1 to 99
Railroad features:
Mbta Commuter Rail
Length: 0.18 miles
Direction: SW-NE
Direction: SW-NE
Mbta RR
Length: 0.05 miles
Direction: SW-NE
Direction: SW-NE