Waterford neighborhood in Woodstock, Georgia (GA), 30189 detailed profile
Settings
X


Business Search - 14 Million verified businesses
Area: 0.105 square miles
Population: 1,952
Population density:
| Waterford: | 18,528 people per square mile |
| Woodstock: | 3,991 people per square mile |

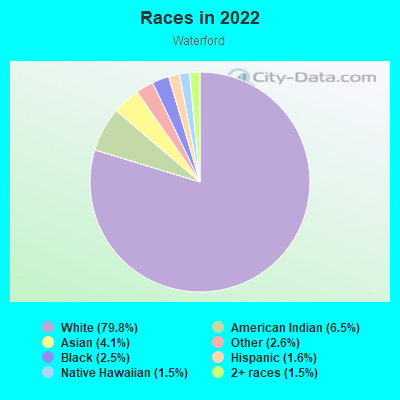
- 1,73879.8%White
- 1416.5%American Indian
- 904.1%Asian
- 562.6%Some other race
- 542.5%Black
- 351.6%Hispanic or Latino
- 331.5%Native Hawaiian and Other
Pacific Islander - 321.5%Two or more races
Median household income in 2022:
| Waterford: | $191,906 |
| Woodstock: | $100,913 |
Distribution of median household income
![Distribution of median household income]()
- 12Less than $10,000
- 62$10,000 to $19,999
- 37$20,000 to $29,999
- 76$30,000 to $39,999
- 70$40,000 to $49,999
- 16$50,000 to $59,999
- 48$60,000 to $74,999
- 103$75,000 to $99,999
- 42$100,000 to $124,999
- 50$125,000 to $149,999
- 122$150,000 to $199,999
- 386$200,000 or more

Distribution of owner-occupied house/condo value
![Distribution of owner-occupied house/condo value]()
- 16Less than $50,000
- 60$50,000 to $99,999
- 159$100,000 to $149,999
- 82$150,000 to $199,999
- 14$200,000 to $249,999
- 51$250,000 to $299,999
- 79$300,000 to $399,999
- 211$400,000 to $499,999
- 309$500,000 to $749,999
- 142$750,000 to $999,999
- 116$1,000,000 or more

Distribution of rent paid by renters
![Distribution of rent paid by renters]()
- 3$200 to $299
- 29$500 to $599
- 5$600 to $699
- 19$800 to $899
- 10$900 to $999
- 28$1,000 to $1,249
- 14$1,250 to $1,499
- 75$1,500 to $1,999
- 77$2,000 or more

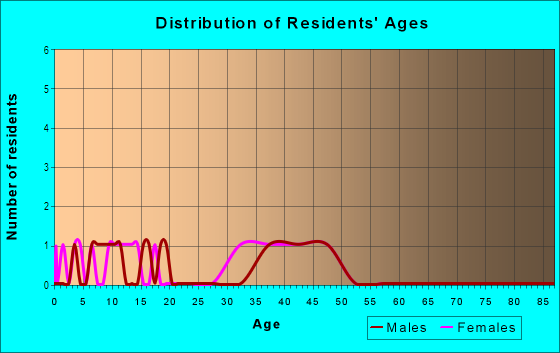
| Males: | 910 |
| Females: | 1,041 |
Males:
| This neighborhood: | 53.2 years |
| Whole city: | 36.7 years |
| This neighborhood: | 53.4 years |
| Whole city: | 36.1 years |
Average household size:
| Waterford: | 8.3 people |
| Woodstock: | 2.6 people |
Percentage of family households:
| Waterford: | 32.7% |
| Woodstock: | 54.1% |
| Here: | 63.6% |
| Woodstock: | 50.9% |
Percentage of married-couple families with children (among all households):
| Waterford: | 42.3% |
| Woodstock: | 30.7% |
Percentage of single-mother households (among all households):
| Waterford: | 2.7% |
| Woodstock: | 4.1% |
Percentage of never married males 15 years old and over:
Percentage of never married females 15 years old and over:
| Waterford: | 8.2% |
| Woodstock: | 13.8% |
Percentage of never married females 15 years old and over:
| Waterford: | 7.0% |
| city: | 16.7% |
Percentage of people that speak English not well or not at all:
| Waterford: | 0.3% |
| Woodstock: | 2.2% |
Percentage of people born in this state:
Percentage of people born in another U.S. state:
Percentage of native residents but born outside the U.S.:
Percentage of foreign born residents:
| Here: | 38.9% |
| Woodstock: | 40.7% |
Percentage of people born in another U.S. state:
| Waterford: | 49.6% |
| Woodstock: | 47.7% |
Percentage of native residents but born outside the U.S.:
| Here: | 1.7% |
| city: | 0.9% |
Percentage of foreign born residents:
| Here: | 9.8% |
| Woodstock: | 10.7% |
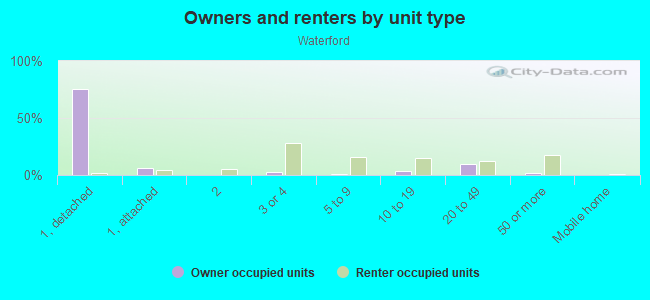
Owner-occupied
Renter-occupied

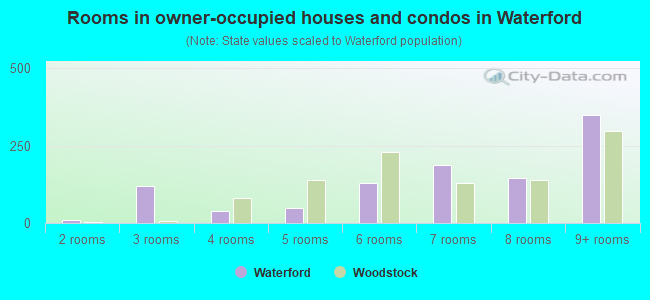
- Rooms in owner-occupied houses and condos in Waterford
- 01 room
- 92 rooms
- 1203 rooms
- 384 rooms
- 505 rooms
- 1286 rooms
- 1867 rooms
- 1448 rooms
- 3499+ rooms
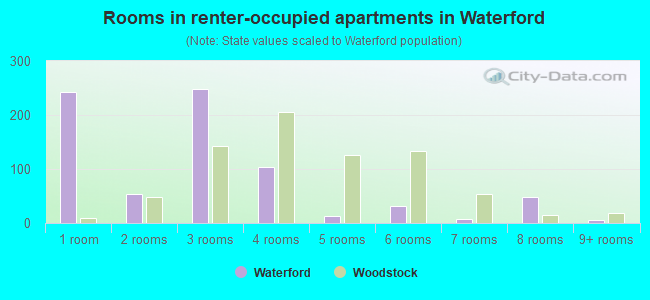
- Rooms in renter-occupied apartments in Waterford
- 2431 room
- 532 rooms
- 2483 rooms
- 1034 rooms
- 135 rooms
- 316 rooms
- 87 rooms
- 498 rooms
- 69+ rooms
Owner-occupied
Renter-occupied
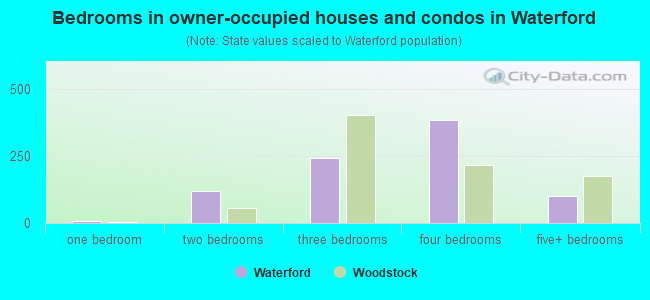
- Bedrooms in owner-occupied houses and condos in Waterford
- 0no bedroom
- 91 bedroom
- 1212 bedrooms
- 2433 bedrooms
- 3844 bedrooms
- 1005+ bedrooms
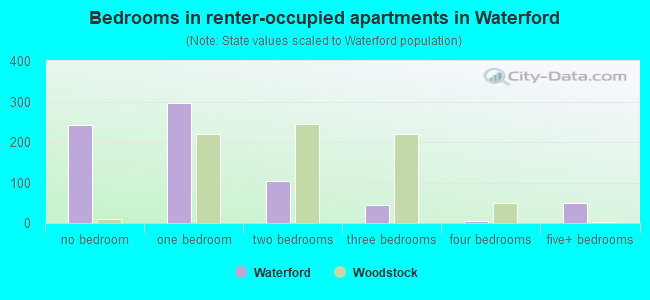
- Bedrooms in renter-occupied apartments in Waterford
- 243no bedroom
- 2971 bedroom
- 1032 bedrooms
- 453 bedrooms
- 64 bedrooms
- 495+ bedrooms
Average number of cars or other vehicles available in houses/condos:
Average number of cars or other vehicles available in apartments:
| This neighborhood: | 2.7 |
| Woodstock: | 2.1 |
Average number of cars or other vehicles available in apartments:
| Here: | 7.9 |
| city: | 1.5 |
Percentage of units with a mortgage:
| Waterford: | 53.9% |
| Woodstock: | 83.5% |
Average estimated value of detached houses in 2022 (83.1% of all units):
| Waterford: | $623,756 |
| Woodstock: | $396,296 |
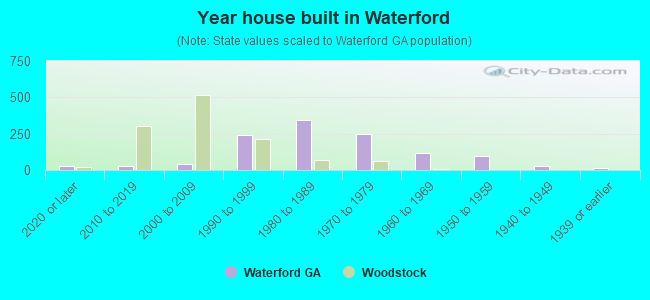
- Year house built in Waterford
- 282020 or later
- 262010 to 2019
- 422000 to 2009
- 2391990 to 1999
- 3471980 to 1989
- 2491970 to 1979
- 1181960 to 1969
- 981950 to 1959
- 271940 to 1949
- 161939 or earlier
City-data.com crime index for city in 2020 (higher means more crime):
| City: | 89.6 |
| U.S. average: | 219.5 |
Travel time to work (commute)
![Travel time to work (commute)]()
- 21Less than 5 minutes
- 485 to 9 minutes
- 3610 to 14 minutes
- 13815 to 19 minutes
- 23520 to 24 minutes
- 9625 to 29 minutes
- 11730 to 34 minutes
- 3835 to 39 minutes
- 2840 to 44 minutes
- 4745 to 59 minutes
- 3760 to 89 minutes
- 1590 or more minutes

Means of transportation to work
![Means of transportation to work]()
- 58.8%433Drove a car alone
- 2.9%21Carpooled
- 1.9%14Bus
- 4.3%32Subway or elevated rail
- 3.8%28Taxi
- 9.9%73Walked
- 3.4%25Other means
- 37.5%276Worked at home

Time leaving home to go to work
![Time leaving home to go to work]()
- 9612:00 a.m. to 4:59 a.m.
- 135:00 a.m. to 5:29 a.m.
- 55:30 a.m. to 5:59 a.m.
- 486:00 a.m. to 6:29 a.m.
- 826:30 a.m. to 6:59 a.m.
- 1547:00 a.m. to 7:29 a.m.
- 1487:30 a.m. to 7:59 a.m.
- 1418:00 a.m. to 8:29 a.m.
- 878:30 a.m. to 8:59 a.m.
- 1049:00 a.m. to 9:59 a.m.
- 1710:00 a.m. to 10:59 a.m.
- 1511:00 a.m. to 11:59 a.m.
- 4912:00 p.m. to 3:59 p.m.
- 404:00 p.m. to 11:59 p.m.

Occupations of males:
- Percentage of males in management occupations (except farmers):
Here: 23.8% city: 14.8%
- Percentage of males in business and financial operations occupations:
Here: 15.0% city: 10.7%
- Percentage of males in computer and mathematical occupations:
Here: 7.0% city: 7.3%
- Percentage of males in architecture and engineering occupations:
Here: 9.4% city: 3.4%
- Percentage of males in legal occupations:
Here: 7.0% city: 0.7%
- Percentage of males in education, training, and library occupations:
Here: 5.2% city: 2.8%
- Percentage of males in healthcare practitioners and technical occupations:
Here: 5.2% city: 2.7%
- Percentage of males in service occupations:
Here: 4.3% city: 11.4%
- Percentage of males in sales and office occupations:
Here: 20.6% city: 18.2%
- Percentage of males in transportation occupations:
Here: 1.8% city: 1.3%
Occupations of females:
- Percentage of females in management occupations (except farmers):
Here: 24.0% city: 16.4%
- Percentage of females in business and financial operations occupations:
Here: 11.4% city: 9.9%
- Percentage of females in life, physical, and social science occupations:
Here: 3.2% city: 0.3%
- Percentage of females in community and social services occupations:
Here: 3.9% city: 2.0%
- Percentage of females in legal occupations:
Here: 4.2% city: 0.4%
- Percentage of females in education, training, and library occupations:
Here: 7.8% city: 15.0%
- Percentage of females in arts, design, entertainment, sports, and media occupations:
Here: 2.8% city: 1.8%
- Percentage of females in healthcare practitioners and technical occupations:
Here: 11.0% city: 7.6%
- Percentage of females in service occupations:
Here: 9.0% city: 15.2%
- Percentage of females in sales and office occupations:
Here: 26.3% city: 22.2%
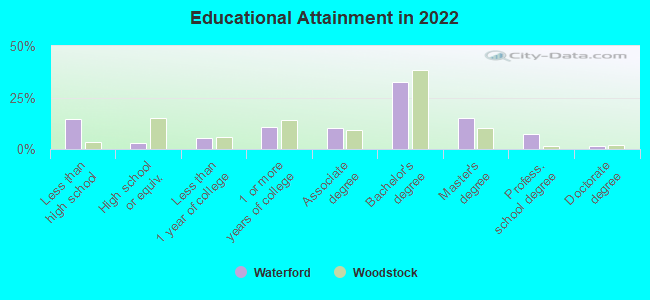
Education in this neighborhood (subdivision or community):
- Percentage of people 3 years and older in K-12 schools:
Waterford: 20.1% Woodstock: 18.6%
- Percentage of people 3 years and older in undergraduate colleges:
Waterford: 6.9% Woodstock: 5.6%
- Percentage of people 3 years and older in grad. or professional schools:
Waterford: 1.9% Woodstock: 1.8%
- Percentage of students K-12 enrolled in private schools:
Waterford: 109.9% Woodstock: 17.1%
Percentage of population below poverty level:
| Waterford: | 1.4% |
| Woodstock: | 5.9% |
Median year owner moved in (as recorded in 2022):
| Waterford: | 2090 |
| Woodstock: | 2013 |
Percentage of married-couple families with both working:
| Waterford: | 91.2% |
| Woodstock: | 76.3% |
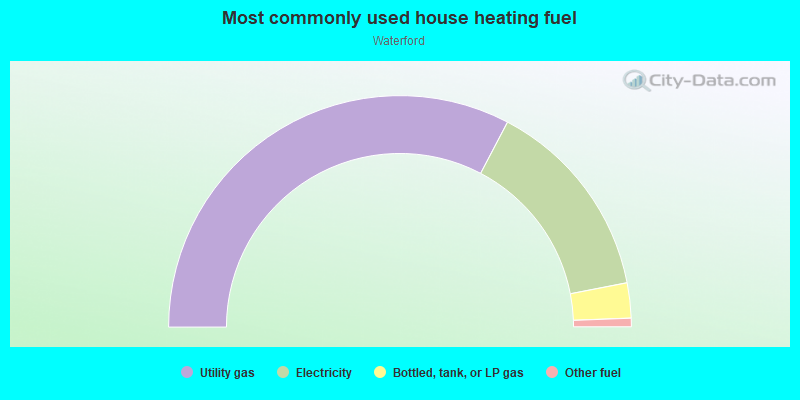
- 65.4%Utility gas
- 28.5%Electricity
- 4.9%Bottled, tank, or LP gas
- 1.2%Other fuel
Roads and streets:
Ashfern Walk
Length: 0.74 miles
Directions: E-W, N-S, SE-NW, SW-NE
Address range: 1000 to 1099
Directions: E-W, N-S, SE-NW, SW-NE
Address range: 1000 to 1099
Castlemaine Cir
Length: 0.33 miles
Directions: E-W, N-S, SE-NW, SW-NE
Address range: 2000 to 2046
Directions: E-W, N-S, SE-NW, SW-NE
Address range: 2000 to 2046
Ballymore Pass
Length: 0.17 miles
Directions: E-W, N-S, SW-NE
Address range: 400 to 499
Directions: E-W, N-S, SW-NE
Address range: 400 to 499
Powers Ct
Length: 0.13 miles
Directions: E-W, N-S, SW-NE
Address range: 200 to 299
Directions: E-W, N-S, SW-NE
Address range: 200 to 299
Linsmore Ter
Length: 0.08 miles
Directions: E-W, SE-NW
Address range: 300 to 399
Directions: E-W, SE-NW
Address range: 300 to 399
Bells Ferry Rd
Length: 0.05 miles
Direction: N-S
Address range: 6694 to 6697
Direction: N-S
Address range: 6694 to 6697
Victoria North Ct
Length: 0.04 miles
Direction: E-W
Address range: 100 to 199
Direction: E-W
Address range: 100 to 199
New Castlemaine Dr
Length: 0.04 miles
Directions: E-W, SW-NE
Directions: E-W, SW-NE
Castle Maine St
Length: 0.02 miles
Direction: SW-NE
Address range: 2000 to 2026
Direction: SW-NE
Address range: 2000 to 2026