Walnut Grove neighborhood in Brighton, Colorado (CO), 80601 detailed profile
Settings
X


Business Search - 14 Million verified businesses
Area: 0.170 square miles
Population: 1,027
Population density:
| Walnut Grove: | 6,046 people per square mile |
| Brighton: | 2,376 people per square mile |

- 55753.8%White
- 44643.1%Hispanic or Latino
- 212.0%Two or more races
- 50.5%Native Hawaiian and Other
Pacific Islander - 20.2%Black
- 20.2%Asian
- 10.10%American Indian
- 10.10%Some other race

Median household income in 2022:
| Walnut Grove: | $62,270 |
| Brighton: | $86,975 |
Distribution of median household income
![Distribution of median household income]()
- 9Less than $10,000
- 30$10,000 to $19,999
- 27$20,000 to $29,999
- 62$30,000 to $39,999
- 21$40,000 to $49,999
- 57$50,000 to $59,999
- 55$60,000 to $74,999
- 76$75,000 to $99,999
- 50$100,000 to $124,999
- 7$125,000 to $149,999
- 17$150,000 to $199,999
- 24$200,000 or more

Distribution of owner-occupied house/condo value
![Distribution of owner-occupied house/condo value]()
- 16Less than $50,000
- 8$100,000 to $149,999
- 3$150,000 to $199,999
- 5$200,000 to $249,999
- 36$250,000 to $299,999
- 71$300,000 to $399,999
- 42$400,000 to $499,999
- 4$500,000 to $749,999
- 8$750,000 to $999,999
- 1$1,000,000 or more

Distribution of rent paid by renters
![Distribution of rent paid by renters]()
- 8$100 to $199
- 7$200 to $299
- 10$300 to $399
- 10$500 to $599
- 24$700 to $799
- 33$800 to $899
- 54$900 to $999
- 15$1,000 to $1,249
- 35$1,250 to $1,499
- 60$1,500 to $1,999
- 27$2,000 or more

Median rent in 2022:
| Walnut Grove: | $1,094 |
| Brighton: | $1,426 |
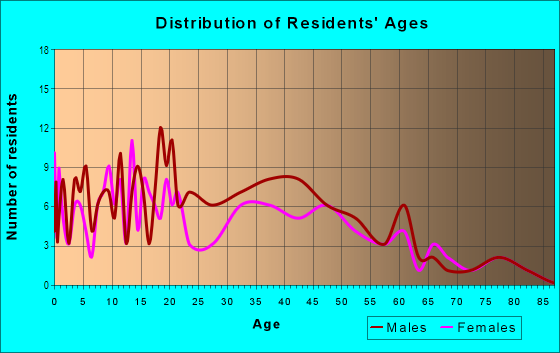
| Males: | 527 |
| Females: | 499 |
Males:
| This neighborhood: | 31.4 years |
| Whole city: | 32.7 years |
| This neighborhood: | 43.8 years |
| Whole city: | 36.0 years |
Average household size:
| Walnut Grove: | 2.4 people |
| Brighton: | 3.0 people |
Percentage of family households:
| Walnut Grove: | 51.6% |
| Brighton: | 60.3% |
| Here: | 44.4% |
| Brighton: | 56.9% |
Percentage of married-couple families with children (among all households):
| Walnut Grove: | 30.0% |
| Brighton: | 24.2% |
Percentage of single-mother households (among all households):
| Walnut Grove: | 9.5% |
| Brighton: | 7.3% |
Percentage of never married males 15 years old and over:
Percentage of never married females 15 years old and over:
| Walnut Grove: | 13.9% |
| Brighton: | 17.0% |
Percentage of never married females 15 years old and over:
| Walnut Grove: | 14.8% |
| city: | 11.6% |
Percentage of people that speak English not well or not at all:
| Walnut Grove: | 0.9% |
| Brighton: | 2.7% |
Percentage of people born in this state:
Percentage of people born in another U.S. state:
Percentage of native residents but born outside the U.S.:
Percentage of foreign born residents:
| Here: | 59.2% |
| Brighton: | 56.5% |
Percentage of people born in another U.S. state:
| Walnut Grove: | 33.2% |
| Brighton: | 33.5% |
Percentage of native residents but born outside the U.S.:
| Here: | 0.7% |
| city: | 1.8% |
Percentage of foreign born residents:
| Here: | 6.8% |
| Brighton: | 8.3% |

Owner-occupied
Renter-occupied


- Rooms in owner-occupied houses and condos in Walnut Grove
- 01 room
- 02 rooms
- 33 rooms
- 204 rooms
- 745 rooms
- 96 rooms
- 87 rooms
- 1138 rooms
- 359+ rooms

- Rooms in renter-occupied apartments in Walnut Grove
- 221 room
- 242 rooms
- 213 rooms
- 294 rooms
- 545 rooms
- 476 rooms
- 27 rooms
- 228 rooms
- 309+ rooms
Owner-occupied
Renter-occupied

- Bedrooms in owner-occupied houses and condos in Walnut Grove
- 0no bedroom
- 111 bedroom
- 972 bedrooms
- 223 bedrooms
- 224 bedrooms
- 95+ bedrooms

- Bedrooms in renter-occupied apartments in Walnut Grove
- 22no bedroom
- 561 bedroom
- 732 bedrooms
- 713 bedrooms
- 234 bedrooms
- 65+ bedrooms
Average number of cars or other vehicles available in houses/condos:
Average number of cars or other vehicles available in apartments:
| This neighborhood: | 2.7 |
| Brighton: | 2.5 |
Average number of cars or other vehicles available in apartments:
| Here: | 1.8 |
| city: | 1.7 |
Percentage of units with a mortgage:
| Walnut Grove: | 76.7% |
| Brighton: | 77.9% |

- Year house built in Walnut Grove
- 02020 or later
- 02010 to 2019
- 52000 to 2009
- 361990 to 1999
- 491980 to 1989
- 71970 to 1979
- 261960 to 1969
- 491950 to 1959
- 651940 to 1949
- 1801939 or earlier

City-data.com crime index for city in 2020 (higher means more crime):
| City: | 304.4 |
| U.S. average: | 219.5 |
Travel time to work (commute)
![Travel time to work (commute)]()
- 2Less than 5 minutes
- 525 to 9 minutes
- 5710 to 14 minutes
- 3015 to 19 minutes
- 2820 to 24 minutes
- 525 to 29 minutes
- 6630 to 34 minutes
- 335 to 39 minutes
- 2340 to 44 minutes
- 4745 to 59 minutes
- 2060 to 89 minutes
- 1290 or more minutes

Means of transportation to work
![Means of transportation to work]()
- 72.6%335Drove a car alone
- 6.5%30Carpooled
- 1.3%6Bus
- 0.2%1Walked
- 0.4%2Other means
- 20.6%95Worked at home

Time leaving home to go to work
![Time leaving home to go to work]()
- 3312:00 a.m. to 4:59 a.m.
- 235:00 a.m. to 5:29 a.m.
- 765:30 a.m. to 5:59 a.m.
- 116:00 a.m. to 6:29 a.m.
- 526:30 a.m. to 6:59 a.m.
- 267:00 a.m. to 7:29 a.m.
- 287:30 a.m. to 7:59 a.m.
- 138:00 a.m. to 8:29 a.m.
- 328:30 a.m. to 8:59 a.m.
- 169:00 a.m. to 9:59 a.m.
- 310:00 a.m. to 10:59 a.m.
- 111:00 a.m. to 11:59 a.m.
- 1712:00 p.m. to 3:59 p.m.
- 144:00 p.m. to 11:59 p.m.

Occupations of males:
- Percentage of males in management occupations (except farmers):
Here: 3.1% city: 10.5%
- Percentage of males in business and financial operations occupations:
Here: 8.3% city: 3.2%
- Percentage of males in computer and mathematical occupations:
Here: 2.1% city: 3.0%
- Percentage of males in architecture and engineering occupations:
Here: 3.0% city: 2.4%
- Percentage of males in service occupations:
Here: 14.5% city: 9.4%
- Percentage of males in sales and office occupations:
Here: 1.8% city: 15.1%
- Percentage of males in construction, extraction, and maintenance occupations:
Here: 5.6% city: 13.9%
- Percentage of males in production occupations:
Here: 27.6% city: 7.3%
- Percentage of males in transportation occupations:
Here: 10.1% city: 9.7%
- Percentage of males in material moving occupations:
Here: 8.7% city: 10.0%
Occupations of females:
- Percentage of females in management occupations (except farmers):
Here: 8.5% city: 9.8%
- Percentage of females in business and financial operations occupations:
Here: 14.4% city: 7.9%
- Percentage of females in education, training, and library occupations:
Here: 14.5% city: 12.7%
- Percentage of females in service occupations:
Here: 33.7% city: 18.2%
- Percentage of females in sales and office occupations:
Here: 16.1% city: 30.5%
- Percentage of females in construction, extraction, and maintenance occupations:
Here: 12.5% city: 0.7%
- Percentage of females in production occupations:
Here: 2.0% city: 2.7%
- Percentage of females in material moving occupations:
Here: 6.0% city: 2.6%
Education in this neighborhood (subdivision or community):
- Percentage of people 3 years and older in K-12 schools:
Walnut Grove: 23.4% Brighton: 21.7%
- Percentage of people 3 years and older in undergraduate colleges:
Walnut Grove: 1.1% Brighton: 1.9%
- Percentage of people 3 years and older in grad. or professional schools:
Walnut Grove: 0.6% Brighton: 0.9%
- Percentage of students K-12 enrolled in private schools:
Walnut Grove: 10.8% Brighton: 6.3%
Percentage of population below poverty level:
| Walnut Grove: | 6.2% |
| Brighton: | 9.1% |
Median year owner moved in (as recorded in 2022):
Median year renter moved in (as recorded in 2022):
| Walnut Grove: | 2003 |
| Brighton: | 2011 |
Median year renter moved in (as recorded in 2022):
| Walnut Grove: | 2016 |
| Brighton: | 2017 |
Percentage of married-couple families with both working:
| Walnut Grove: | 67.8% |
| Brighton: | 74.9% |

- 85.4%Utility gas
- 12.7%Electricity
- 1.9%Bottled, tank, or LP gas
Highways in this neighborhood:
S 4th Ave (State Hwy 2, State Hwy 51)
Length: 0.38 miles
Direction: N-S
Address range: 50 to 399
Direction: N-S
Address range: 50 to 399
Roads and streets:
Bush St
Length: 0.48 miles
Direction: E-W
Address range: 300 to 799
Direction: E-W
Address range: 300 to 799
S 5th Ave
Length: 0.38 miles
Direction: N-S
Address range: 43 to 399
Direction: N-S
Address range: 43 to 399
S 3rd Ave
Length: 0.32 miles
Direction: N-S
Address range: 100 to 399
Direction: N-S
Address range: 100 to 399
Egbert St (E Egbert St)
Length: 0.25 miles
Direction: E-W
Address range: 240 to 499
Direction: E-W
Address range: 240 to 499
Skeel St
Length: 0.19 miles
Direction: E-W
Address range: 300 to 499
Direction: E-W
Address range: 300 to 499
Mather St
Length: 0.19 miles
Direction: E-W
Address range: 300 to 499
Direction: E-W
Address range: 300 to 499
Court Pl
Length: 0.10 miles
Direction: E-W
Address range: 400 to 499
Direction: E-W
Address range: 400 to 499