Vista del Niguel neighborhood in Laguna Niguel, California (CA), 92677 detailed profile
Settings
X


Business Search - 14 Million verified businesses
Area: 0.311 square miles
Population: 967
Population density:
| Vista del Niguel: | 3,110 people per square mile |
| Laguna Niguel: | 4,383 people per square mile |

- 67066.9%White
- 19719.7%Hispanic or Latino
- 585.8%Asian
- 313.1%Black
- 212.1%Native Hawaiian and Other
Pacific Islander - 141.4%Two or more races
- 80.8%Some other race
- 20.2%American Indian

Median household income in 2022:
| Vista del Niguel: | $145,685 |
| Laguna Niguel: | $135,822 |
Distribution of median household income
![Distribution of median household income]()
- 49Less than $10,000
- 17$10,000 to $19,999
- 22$20,000 to $29,999
- 42$30,000 to $39,999
- 30$40,000 to $49,999
- 24$50,000 to $59,999
- 33$60,000 to $74,999
- 28$75,000 to $99,999
- 80$100,000 to $124,999
- 13$125,000 to $149,999
- 24$150,000 to $199,999
- 86$200,000 or more

Distribution of owner-occupied house/condo value
![Distribution of owner-occupied house/condo value]()
- 11Less than $50,000
- 5$100,000 to $149,999
- 3$150,000 to $199,999
- 29$300,000 to $399,999
- 8$400,000 to $499,999
- 17$500,000 to $749,999
- 66$750,000 to $999,999
- 148$1,000,000 or more

Distribution of rent paid by renters
![Distribution of rent paid by renters]()
- 14$200 to $299
- 29$1,000 to $1,249
- 11$1,250 to $1,499
- 17$1,500 to $1,999
- 196$2,000 or more

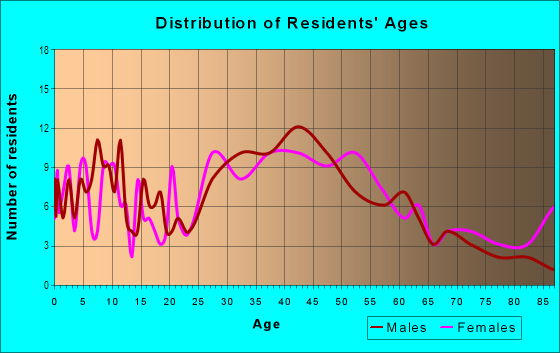
| Males: | 394 |
| Females: | 572 |
Males:
| This neighborhood: | 51.8 years |
| Whole city: | 45.5 years |
| This neighborhood: | 49.1 years |
| Whole city: | 48.2 years |
Average household size:
| Vista del Niguel: | 2.9 people |
| Laguna Niguel: | 2.5 people |
Percentage of family households:
| Vista del Niguel: | 31.1% |
| Laguna Niguel: | 45.5% |
| Here: | 45.5% |
| Laguna Niguel: | 57.2% |
Percentage of married-couple families with children (among all households):
| Vista del Niguel: | 26.3% |
| Laguna Niguel: | 32.0% |
Percentage of single-mother households (among all households):
| Vista del Niguel: | 13.4% |
| Laguna Niguel: | 5.1% |
Percentage of never married males 15 years old and over:
Percentage of never married females 15 years old and over:
| Vista del Niguel: | 15.8% |
| Laguna Niguel: | 14.2% |
Percentage of never married females 15 years old and over:
| Vista del Niguel: | 22.8% |
| city: | 13.7% |
Percentage of people that speak English not well or not at all:
| Vista del Niguel: | 1.2% |
| Laguna Niguel: | 3.6% |
Percentage of people born in this state:
Percentage of people born in another U.S. state:
Percentage of native residents but born outside the U.S.:
Percentage of foreign born residents:
| Here: | 49.6% |
| Laguna Niguel: | 48.2% |
Percentage of people born in another U.S. state:
| Vista del Niguel: | 36.4% |
| Laguna Niguel: | 26.5% |
Percentage of native residents but born outside the U.S.:
| Here: | 1.1% |
| city: | 2.0% |
Percentage of foreign born residents:
| Here: | 13.0% |
| Laguna Niguel: | 23.3% |

Owner-occupied
Renter-occupied


- Rooms in owner-occupied houses and condos in Vista del Niguel
- 01 room
- 82 rooms
- 93 rooms
- 94 rooms
- 415 rooms
- 566 rooms
- 407 rooms
- 508 rooms
- 429+ rooms

- Rooms in renter-occupied apartments in Vista del Niguel
- 361 room
- 152 rooms
- 593 rooms
- 354 rooms
- 395 rooms
- 76 rooms
- 277 rooms
- 228 rooms
- 39+ rooms
Owner-occupied
Renter-occupied

- Bedrooms in owner-occupied houses and condos in Vista del Niguel
- 7no bedroom
- 181 bedroom
- 92 bedrooms
- 993 bedrooms
- 994 bedrooms
- 285+ bedrooms

- Bedrooms in renter-occupied apartments in Vista del Niguel
- 36no bedroom
- 391 bedroom
- 252 bedrooms
- 263 bedrooms
- 144 bedrooms
- 05+ bedrooms
Average number of cars or other vehicles available in houses/condos:
Average number of cars or other vehicles available in apartments:
| This neighborhood: | 2.3 |
| Laguna Niguel: | 2.1 |
Average number of cars or other vehicles available in apartments:
| Here: | 1.6 |
| city: | 1.8 |
Percentage of units with a mortgage:
| Vista del Niguel: | 77.1% |
| Laguna Niguel: | 69.6% |
Average estimated value of detached houses in 2022 (46.6% of all units):
| Vista del Niguel: | $1,404,729 |
| California: | $988,808 |

- Year house built in Vista del Niguel
- 02020 or later
- 1532010 to 2019
- 92000 to 2009
- 331990 to 1999
- 281980 to 1989
- 2861970 to 1979
- 1131960 to 1969
- 91950 to 1959
- 41940 to 1949
- 91939 or earlier

City-data.com crime index for city in 2020 (higher means more crime):
| City: | 62.1 |
| U.S. average: | 219.5 |
Travel time to work (commute)
![Travel time to work (commute)]()
- 10Less than 5 minutes
- 415 to 9 minutes
- 5110 to 14 minutes
- 4715 to 19 minutes
- 3520 to 24 minutes
- 1925 to 29 minutes
- 11830 to 34 minutes
- 1235 to 39 minutes
- 640 to 44 minutes
- 1345 to 59 minutes
- 4160 to 89 minutes
- 1290 or more minutes

Means of transportation to work
![Means of transportation to work]()
- 57.0%230Drove a car alone
- 19.1%77Carpooled
- 8.4%34Bus
- 1.2%5Taxi
- 11.2%45Walked
- 2.0%8Other means
- 6.9%28Worked at home

Time leaving home to go to work
![Time leaving home to go to work]()
- 312:00 a.m. to 4:59 a.m.
- 25:00 a.m. to 5:29 a.m.
- 155:30 a.m. to 5:59 a.m.
- 366:00 a.m. to 6:29 a.m.
- 186:30 a.m. to 6:59 a.m.
- 357:00 a.m. to 7:29 a.m.
- 477:30 a.m. to 7:59 a.m.
- 488:00 a.m. to 8:29 a.m.
- 1218:30 a.m. to 8:59 a.m.
- 309:00 a.m. to 9:59 a.m.
- 1710:00 a.m. to 10:59 a.m.
- 611:00 a.m. to 11:59 a.m.
- 1012:00 p.m. to 3:59 p.m.
- 94:00 p.m. to 11:59 p.m.

Occupations of males:
- Percentage of males in management occupations (except farmers):
Here: 11.5% city: 18.9%
- Percentage of males in business and financial operations occupations:
Here: 8.3% city: 9.3%
- Percentage of males in computer and mathematical occupations:
Here: 1.7% city: 7.2%
- Percentage of males in architecture and engineering occupations:
Here: 1.2% city: 6.2%
- Percentage of males in legal occupations:
Here: 1.3% city: 2.8%
- Percentage of males in arts, design, entertainment, sports, and media occupations:
Here: 6.7% city: 2.9%
- Percentage of males in healthcare practitioners and technical occupations:
Here: 12.3% city: 4.6%
- Percentage of males in service occupations:
Here: 13.6% city: 11.4%
- Percentage of males in sales and office occupations:
Here: 16.0% city: 21.5%
- Percentage of males in production occupations:
Here: 18.9% city: 2.1%
- Percentage of males in transportation occupations:
Here: 6.3% city: 1.2%
- Percentage of males in material moving occupations:
Here: 1.8% city: 2.4%
Occupations of females:
- Percentage of females in management occupations (except farmers):
Here: 6.9% city: 12.8%
- Percentage of females in education, training, and library occupations:
Here: 17.1% city: 7.6%
- Percentage of females in arts, design, entertainment, sports, and media occupations:
Here: 5.8% city: 3.2%
- Percentage of females in healthcare practitioners and technical occupations:
Here: 4.1% city: 10.1%
- Percentage of females in service occupations:
Here: 13.5% city: 18.3%
- Percentage of females in sales and office occupations:
Here: 47.4% city: 25.8%
- Percentage of females in transportation occupations:
Here: 3.2% city: 0.5%
Percentage of people 16-64 in Armed Forces:
| Vista del Niguel: | 0.0% |
| Laguna Niguel: | 0.3% |
Education in this neighborhood (subdivision or community):
- Percentage of people 3 years and older in K-12 schools:
Vista del Niguel: 21.7% Laguna Niguel: 13.6%
- Percentage of people 3 years and older in undergraduate colleges:
Vista del Niguel: 12.3% Laguna Niguel: 5.5%
- Percentage of people 3 years and older in grad. or professional schools:
Vista del Niguel: 1.4% Laguna Niguel: 1.8%
- Percentage of students K-12 enrolled in private schools:
Vista del Niguel: 30.0% Laguna Niguel: 17.8%
Percentage of population below poverty level:
| Vista del Niguel: | 6.1% |
| Laguna Niguel: | 7.4% |
Median year owner moved in (as recorded in 2022):
| Vista del Niguel: | 1998 |
| Laguna Niguel: | 2005 |
Percentage of married-couple families with both working:
| Vista del Niguel: | 131.1% |
| Laguna Niguel: | 64.1% |

- 75.3%Utility gas
- 16.4%Electricity
- 1.8%Wood
- 1.8%Solar energy
- 1.7%No fuel used
- 1.5%Bottled, tank, or LP gas
- 1.5%Fuel oil, kerosene, etc.
Roads and streets:
Crown Valley Pkwy
Length: 0.81 miles
Directions: N-S, SW-NE
Address range: 30100 to 30599
Directions: N-S, SW-NE
Address range: 30100 to 30599
Hillhurst Dr
Length: 0.69 miles
Directions: E-W, N-S, SE-NW, SW-NE
Address range: 23600 to 24199
Directions: E-W, N-S, SE-NW, SW-NE
Address range: 23600 to 24199
Pso del Campo
Length: 0.60 miles
Directions: E-W, N-S, SE-NW, SW-NE
Address range: 23700 to 24299
Directions: E-W, N-S, SE-NW, SW-NE
Address range: 23700 to 24299
Niguel Rd
Length: 0.50 miles
Direction: SE-NW
Address range: 30000 to 30199
Direction: SE-NW
Address range: 30000 to 30199
Pso del Valle
Length: 0.47 miles
Directions: E-W, N-S, SE-NW, SW-NE
Address range: 30300 to 30699
Directions: E-W, N-S, SE-NW, SW-NE
Address range: 30300 to 30699
Benecia Ave
Length: 0.33 miles
Directions: E-W, N-S, SW-NE
Address range: 30300 to 30499
Directions: E-W, N-S, SW-NE
Address range: 30300 to 30499
la Hermosa Ave
Length: 0.31 miles
Directions: E-W, SE-NW, SW-NE
Address range: 23800 to 24159
Directions: E-W, SE-NW, SW-NE
Address range: 23800 to 24159
Estacia Ave
Length: 0.31 miles
Directions: E-W, SE-NW
Address range: 23800 to 24199
Directions: E-W, SE-NW
Address range: 23800 to 24199
el Mirage Ave
Length: 0.20 miles
Directions: E-W, SE-NW, SW-NE
Address range: 23880 to 24199
Directions: E-W, SE-NW, SW-NE
Address range: 23880 to 24199
Grande Vista Ave
Length: 0.19 miles
Directions: E-W, N-S, SE-NW
Address range: 30200 to 30499
Directions: E-W, N-S, SE-NW
Address range: 30200 to 30499
Flores Ave
Length: 0.15 miles
Directions: E-W, N-S, SE-NW
Address range: 23800 to 23999
Directions: E-W, N-S, SE-NW
Address range: 23800 to 23999
Las Colinas Ct
Length: 0.07 miles
Directions: E-W, SE-NW
Address range: 23500 to 23699
Directions: E-W, SE-NW
Address range: 23500 to 23699
Mirador Ct
Length: 0.03 miles
Direction: SW-NE
Address range: 30400 to 30499
Direction: SW-NE
Address range: 30400 to 30499