Villas of South Holland neighborhood in South Holland, Illinois (IL), 60473 detailed profile
Settings
X


Business Search - 14 Million verified businesses
Area: 0.022 square miles
Population: 352
Population density:
| Villas of South Holland: | 16,198 people per square mile |
| South Holland: | 2,924 people per square mile |

- 16847.9%Black
- 13839.3%White
- 216.0%Asian
- 154.3%Hispanic or Latino
- 92.6%Two or more races

Median household income in 2022:
| Villas of South Holland: | $72,068 |
| South Holland: | $79,567 |
Distribution of median household income
![Distribution of median household income]()
- 5Less than $10,000
- 8$10,000 to $19,999
- 6$20,000 to $29,999
- 24$30,000 to $39,999
- 10$40,000 to $49,999
- 3$50,000 to $59,999
- 12$60,000 to $74,999
- 49$75,000 to $99,999
- 18$100,000 to $124,999
- 2$125,000 to $149,999
- 16$150,000 to $199,999
- 3$200,000 or more

Distribution of owner-occupied house/condo value
![Distribution of owner-occupied house/condo value]()
- 6Less than $50,000
- 24$50,000 to $99,999
- 21$100,000 to $149,999
- 37$150,000 to $199,999
- 25$200,000 to $249,999
- 4$250,000 to $299,999
- 8$300,000 to $399,999
- 3$400,000 to $499,999
- 6$500,000 to $749,999

Distribution of rent paid by renters
![Distribution of rent paid by renters]()
- 4$400 to $499
- 1$700 to $799
- 14$800 to $899
- 2$900 to $999
- 3$1,250 to $1,499
- 7$1,500 to $1,999
- 2$2,000 or more

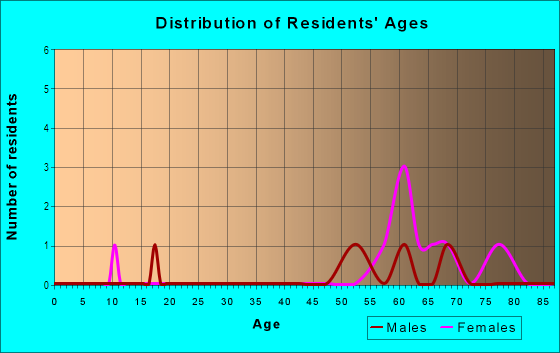
| Males: | 153 |
| Females: | 198 |
Males:
| This neighborhood: | 36.9 years |
| Whole city: | 43.3 years |
| This neighborhood: | 43.5 years |
| Whole city: | 42.3 years |
Average household size:
| Villas of South Holland: | 2.8 people |
| South Holland: | 2.7 people |
Percentage of family households:
| Villas of South Holland: | 60.0% |
| South Holland: | 49.5% |
| Here: | 42.0% |
| South Holland: | 41.1% |
Percentage of married-couple families with children (among all households):
| Villas of South Holland: | 14.3% |
| South Holland: | 15.8% |
Percentage of single-mother households (among all households):
| Villas of South Holland: | 13.4% |
| South Holland: | 16.2% |
Percentage of never married males 15 years old and over:
Percentage of never married females 15 years old and over:
| Villas of South Holland: | 16.2% |
| South Holland: | 19.0% |
Percentage of never married females 15 years old and over:
| Villas of South Holland: | 22.2% |
| village: | 23.5% |
Percentage of people that speak English not well or not at all:
| Villas of South Holland: | 0.3% |
| South Holland: | 0.7% |
Percentage of people born in this state:
Percentage of people born in another U.S. state:
Percentage of native residents but born outside the U.S.:
Percentage of foreign born residents:
| Here: | 80.7% |
| South Holland: | 77.5% |
Percentage of people born in another U.S. state:
| Villas of South Holland: | 14.2% |
| South Holland: | 16.8% |
Percentage of native residents but born outside the U.S.:
| Here: | 0.8% |
| village: | 0.9% |
Percentage of foreign born residents:
| Here: | 4.4% |
| South Holland: | 4.8% |

Owner-occupied
Renter-occupied


- Rooms in owner-occupied houses and condos in Villas of South Holland
- 01 room
- 02 rooms
- 03 rooms
- 24 rooms
- 105 rooms
- 666 rooms
- 167 rooms
- 88 rooms
- 189+ rooms

- Rooms in renter-occupied apartments in Villas of South Holland
- 01 room
- 02 rooms
- 03 rooms
- 04 rooms
- 155 rooms
- 36 rooms
- 07 rooms
- 18 rooms
- 19+ rooms
Owner-occupied
Renter-occupied

- Bedrooms in owner-occupied houses and condos in Villas of South Holland
- 0no bedroom
- 01 bedroom
- 332 bedrooms
- 683 bedrooms
- 84 bedrooms
- 115+ bedrooms

- Bedrooms in renter-occupied apartments in Villas of South Holland
- 0no bedroom
- 01 bedroom
- 152 bedrooms
- 33 bedrooms
- 14 bedrooms
- 05+ bedrooms
Average number of cars or other vehicles available in houses/condos:
Average number of cars or other vehicles available in apartments:
| This neighborhood: | 2.0 |
| South Holland: | 1.8 |
Average number of cars or other vehicles available in apartments:
| Here: | 1.1 |
| village: | 1.7 |
Percentage of units with a mortgage:
| Villas of South Holland: | 86.2% |
| South Holland: | 78.1% |
Average estimated value of detached houses in 2022 (93.5% of all units):
| Villas of South Holland: | $143,467 |
| Illinois: | $310,164 |

- Year house built in Villas of South Holland
- 02020 or later
- 12010 to 2019
- 12000 to 2009
- 11990 to 1999
- 61980 to 1989
- 211970 to 1979
- 371960 to 1969
- 471950 to 1959
- 161940 to 1949
- 211939 or earlier

City-data.com crime index for village in 2020 (higher means more crime):
| City: | 225.2 |
| U.S. average: | 219.5 |
Travel time to work (commute)
![Travel time to work (commute)]()
- 1Less than 5 minutes
- 25 to 9 minutes
- 510 to 14 minutes
- 415 to 19 minutes
- 120 to 24 minutes
- 125 to 29 minutes
- 1130 to 34 minutes
- 235 to 39 minutes
- 240 to 44 minutes
- 1445 to 59 minutes
- 660 to 89 minutes
- 190 or more minutes

Means of transportation to work
![Means of transportation to work]()
- 76.6%128Drove a car alone
- 12.6%21Carpooled
- 0.6%1Bus
- 1.2%2Subway or elevated rail
- 2.4%4Long-distance train or commuter rail
- 6.6%11Light rail, streetcar or trolley
- 3.0%5Taxi
- 1.2%2Walked
- 3.0%5Worked at home

Time leaving home to go to work
![Time leaving home to go to work]()
- 312:00 a.m. to 4:59 a.m.
- 35:00 a.m. to 5:29 a.m.
- 35:30 a.m. to 5:59 a.m.
- 26:00 a.m. to 6:29 a.m.
- 76:30 a.m. to 6:59 a.m.
- 57:00 a.m. to 7:29 a.m.
- 17:30 a.m. to 7:59 a.m.
- 38:00 a.m. to 8:29 a.m.
- 18:30 a.m. to 8:59 a.m.
- 49:00 a.m. to 9:59 a.m.
- 312:00 p.m. to 3:59 p.m.
- 64:00 p.m. to 11:59 p.m.

Occupations of males:
- Percentage of males in management occupations (except farmers):
Here: 14.1% village: 10.5%
- Percentage of males in architecture and engineering occupations:
Here: 3.0% village: 2.2%
- Percentage of males in education, training, and library occupations:
Here: 5.4% village: 2.6%
- Percentage of males in arts, design, entertainment, sports, and media occupations:
Here: 3.0% village: 0.6%
- Percentage of males in service occupations:
Here: 5.7% village: 14.3%
- Percentage of males in sales and office occupations:
Here: 7.3% village: 15.1%
- Percentage of males in production occupations:
Here: 26.2% village: 13.1%
- Percentage of males in transportation occupations:
Here: 25.8% village: 17.7%
Occupations of females:
- Percentage of females in management occupations (except farmers):
Here: 4.3% village: 14.9%
- Percentage of females in business and financial operations occupations:
Here: 3.9% village: 8.5%
- Percentage of females in community and social services occupations:
Here: 2.8% village: 3.5%
- Percentage of females in education, training, and library occupations:
Here: 16.3% village: 8.2%
- Percentage of females in arts, design, entertainment, sports, and media occupations:
Here: 2.8% village: 0.4%
- Percentage of females in healthcare practitioners and technical occupations:
Here: 13.3% village: 7.0%
- Percentage of females in service occupations:
Here: 14.8% village: 14.5%
- Percentage of females in sales and office occupations:
Here: 30.2% village: 30.7%
- Percentage of females in production occupations:
Here: 4.8% village: 2.7%
- Percentage of females in transportation occupations:
Here: 2.3% village: 1.1%
- Percentage of females in material moving occupations:
Here: 4.6% village: 3.0%
Percentage of people 16-64 in Armed Forces:
| Villas of South Holland: | 0.4% |
| South Holland: | 0.1% |
Education in this neighborhood (subdivision or community):
- Percentage of people 3 years and older in K-12 schools:
Villas of South Holland: 7.7% South Holland: 17.9%
- Percentage of people 3 years and older in undergraduate colleges:
Villas of South Holland: 2.1% South Holland: 5.0%
- Percentage of people 3 years and older in grad. or professional schools:
Villas of South Holland: 5.0% South Holland: 2.6%
- Percentage of students K-12 enrolled in private schools:
Villas of South Holland: 15.4% South Holland: 9.3%
Percentage of population below poverty level:
| Villas of South Holland: | 19.8% |
| South Holland: | 14.1% |
Median year owner moved in (as recorded in 2022):
| Villas of South Holland: | 2009 |
| South Holland: | 2005 |
Percentage of married-couple families with both working:
| Villas of South Holland: | 79.8% |
| South Holland: | 79.2% |

- 88.0%Utility gas
- 11.2%Electricity
- 0.8%Bottled, tank, or LP gas
Highways in this neighborhood:
E 162nd St (US Hwy 6, 159th St)
Length: 0.15 miles
Direction: E-W
Address range: 132 to 199
Direction: E-W
Address range: 132 to 199
Roads and streets:
E 163rd St
Length: 0.15 miles
Directions: E-W, SW-NE
Directions: E-W, SW-NE
E 162 Ln
Length: 0.14 miles
Directions: E-W, SE-NW, SW-NE
Address range: 1 to 199
Directions: E-W, SE-NW, SW-NE
Address range: 1 to 199
Michigan Ave
Length: 0.07 miles
Directions: N-S, SE-NW, SW-NE
Address range: 16200 to 16299
Directions: N-S, SE-NW, SW-NE
Address range: 16200 to 16299
Railroad features:
Missouri Pacific RR
Length: 0.13 miles
Direction: N-S
Direction: N-S