Vermont (McKendrie) neighborhood in San Jose, California (CA), 95126 detailed profile
Settings
X


Business Search - 14 Million verified businesses
Area: 0.077 square miles
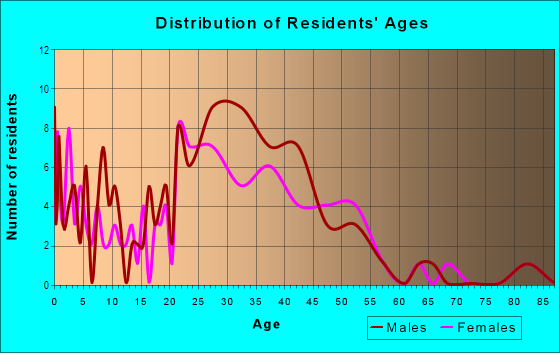
Population: 551
Population density:
| Vermont (McKendrie): | 7,148 people per square mile |
| San Jose: | 5,554 people per square mile |

- 21138.1%Hispanic or Latino
- 16830.3%White
- 7112.8%Asian
- 529.4%Two or more races
- 447.9%Black
- 61.1%Native Hawaiian and Other
Pacific Islander - 20.4%Some other race

Median household income in 2022:
| Vermont (McKendrie): | $146,987 |
| San Jose: | $133,835 |
Distribution of median household income
![Distribution of median household income]()
- 3Less than $10,000
- 4$10,000 to $19,999
- 6$20,000 to $29,999
- 10$30,000 to $39,999
- 7$40,000 to $49,999
- 6$50,000 to $59,999
- 13$60,000 to $74,999
- 14$75,000 to $99,999
- 27$100,000 to $124,999
- 33$125,000 to $149,999
- 28$150,000 to $199,999
- 65$200,000 or more

Distribution of owner-occupied house/condo value
![Distribution of owner-occupied house/condo value]()
- 2Less than $50,000
- 1$50,000 to $99,999
- 6$100,000 to $149,999
- 2$300,000 to $399,999
- 1$500,000 to $749,999
- 21$750,000 to $999,999
- 57$1,000,000 or more

Distribution of rent paid by renters
![Distribution of rent paid by renters]()
- 3Less than $100
- 1$200 to $299
- 19$300 to $399
- 1$400 to $499
- 2$500 to $599
- 1$600 to $699
- 1$900 to $999
- 3$1,000 to $1,249
- 3$1,250 to $1,499
- 29$1,500 to $1,999
- 90$2,000 or more

Median rent in 2022:
| Vermont (McKendrie): | $2,320 |
| San Jose: | $2,001 |
| Males: | 319 |
| Females: | 232 |
Males:
| This neighborhood: | 37.8 years |
| Whole city: | 37.6 years |
| This neighborhood: | 35.3 years |
| Whole city: | 39.1 years |
Average household size:
| Vermont (McKendrie): | 4.6 people |
| San Jose: | 2.9 people |
Percentage of family households:
| Vermont (McKendrie): | 54.2% |
| San Jose: | 49.9% |
| Here: | 41.6% |
| San Jose: | 53.0% |
Percentage of married-couple families with children (among all households):
| Vermont (McKendrie): | 24.0% |
| San Jose: | 25.8% |
Percentage of single-mother households (among all households):
| Vermont (McKendrie): | 11.7% |
| San Jose: | 5.2% |
Percentage of never married males 15 years old and over:
Percentage of never married females 15 years old and over:
| Vermont (McKendrie): | 26.4% |
| San Jose: | 20.9% |
Percentage of never married females 15 years old and over:
| Vermont (McKendrie): | 14.1% |
| city: | 16.7% |
Percentage of people that speak English not well or not at all:
| Vermont (McKendrie): | 4.4% |
| San Jose: | 11.4% |
Percentage of people born in this state:
Percentage of people born in another U.S. state:
Percentage of native residents but born outside the U.S.:
Percentage of foreign born residents:
| Here: | 53.5% |
| San Jose: | 46.1% |
Percentage of people born in another U.S. state:
| Vermont (McKendrie): | 17.7% |
| San Jose: | 10.4% |
Percentage of native residents but born outside the U.S.:
| Here: | 2.4% |
| city: | 1.7% |
Percentage of foreign born residents:
| Here: | 28.7% |
| San Jose: | 41.8% |
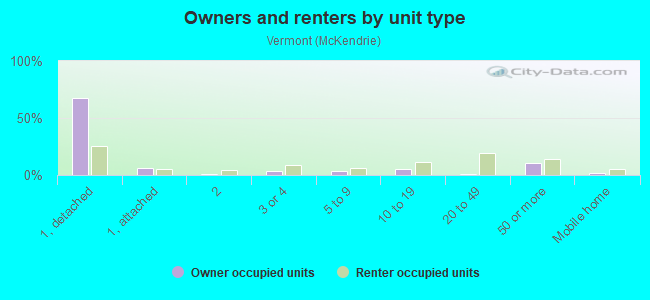
Owner-occupied
Renter-occupied

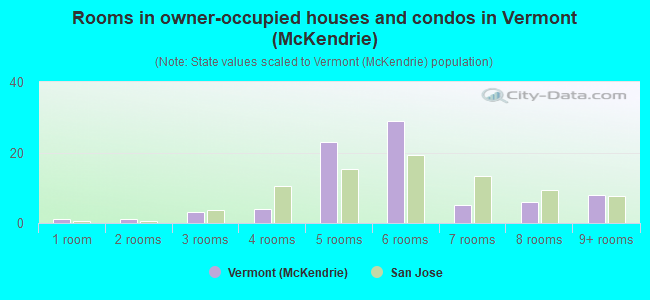
- Rooms in owner-occupied houses and condos in Vermont <
> - 11 room
- 12 rooms
- 33 rooms
- 44 rooms
- 235 rooms
- 296 rooms
- 57 rooms
- 68 rooms
- 89+ rooms
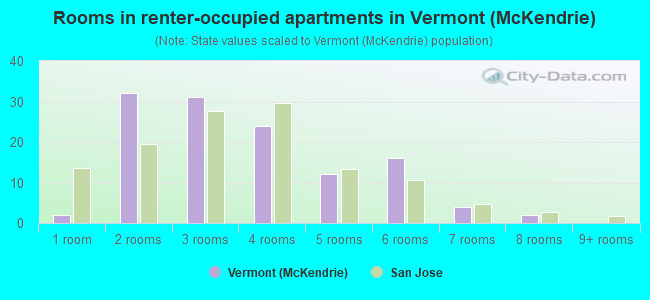
- Rooms in renter-occupied apartments in Vermont <
> - 21 room
- 322 rooms
- 313 rooms
- 244 rooms
- 125 rooms
- 166 rooms
- 47 rooms
- 28 rooms
- 09+ rooms
Owner-occupied
Renter-occupied
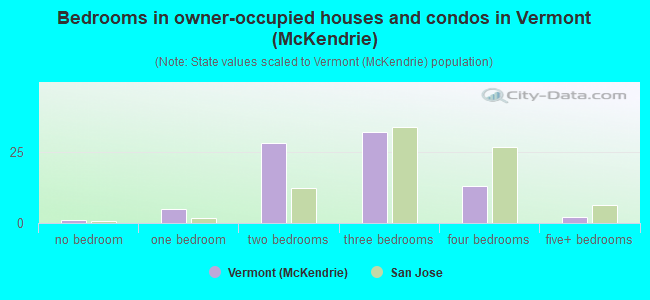
- Bedrooms in owner-occupied houses and condos in Vermont <
> - 1no bedroom
- 51 bedroom
- 282 bedrooms
- 323 bedrooms
- 134 bedrooms
- 25+ bedrooms
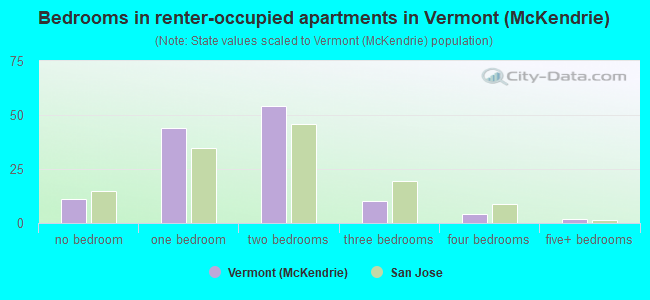
- Bedrooms in renter-occupied apartments in Vermont <
> - 11no bedroom
- 441 bedroom
- 542 bedrooms
- 103 bedrooms
- 44 bedrooms
- 25+ bedrooms
Average number of cars or other vehicles available in houses/condos:
Average number of cars or other vehicles available in apartments:
| This neighborhood: | 2.6 |
| San Jose: | 2.3 |
Average number of cars or other vehicles available in apartments:
| Here: | 1.8 |
| city: | 1.6 |
Percentage of units with a mortgage:
| Vermont (McKendrie): | 75.2% |
| San Jose: | 66.9% |
Housing prices:
- Average estimated value of detached houses in 2022 (51.0% of all units):
Vermont (McKendrie): $950,645 San Jose: $1,532,815
- Average estimated value of townhouses or other attached units in 2022 (6.8% of all units):
This neighborhood: $5,625,519 city: $1,024,857
- Average estimated '22 value of housing units in 5-or-more-unit structures (17.0% of all units):
Vermont (McKendrie): $362,214 San Jose: $791,954

- Year house built in Vermont <
> - 42020 or later
- 22010 to 2019
- 32000 to 2009
- 21990 to 1999
- 251980 to 1989
- 291970 to 1979
- 371960 to 1969
- 161950 to 1959
- 131940 to 1949
- 921939 or earlier
City-data.com crime index for city in 2020 (higher means more crime):
| City: | 268.4 |
| U.S. average: | 219.5 |
Travel time to work (commute)
![Travel time to work (commute)]()
- 5Less than 5 minutes
- 225 to 9 minutes
- 4010 to 14 minutes
- 2715 to 19 minutes
- 1820 to 24 minutes
- 1125 to 29 minutes
- 2530 to 34 minutes
- 1335 to 39 minutes
- 340 to 44 minutes
- 3645 to 59 minutes
- 1360 to 89 minutes
- 1090 or more minutes

Means of transportation to work
![Means of transportation to work]()
- 65.1%223Drove a car alone
- 6.4%22Carpooled
- 5.8%20Bus
- 3.2%11Long-distance train or commuter rail
- 1.2%4Light rail, streetcar or trolley
- 0.6%2Taxi
- 0.6%2Bicycle
- 2.3%8Walked
- 1.2%4Other means
- 14.9%51Worked at home

Time leaving home to go to work
![Time leaving home to go to work]()
- 912:00 a.m. to 4:59 a.m.
- 65:00 a.m. to 5:29 a.m.
- 25:30 a.m. to 5:59 a.m.
- 86:00 a.m. to 6:29 a.m.
- 186:30 a.m. to 6:59 a.m.
- 327:00 a.m. to 7:29 a.m.
- 327:30 a.m. to 7:59 a.m.
- 488:00 a.m. to 8:29 a.m.
- 268:30 a.m. to 8:59 a.m.
- 129:00 a.m. to 9:59 a.m.
- 310:00 a.m. to 10:59 a.m.
- 311:00 a.m. to 11:59 a.m.
- 1012:00 p.m. to 3:59 p.m.
- 94:00 p.m. to 11:59 p.m.

Occupations of males:
- Percentage of males in management occupations (except farmers):
Here: 11.6% city: 13.0%
- Percentage of males in business and financial operations occupations:
Here: 8.2% city: 4.6%
- Percentage of males in computer and mathematical occupations:
Here: 4.0% city: 13.6%
- Percentage of males in architecture and engineering occupations:
Here: 7.8% city: 10.2%
- Percentage of males in life, physical, and social science occupations:
Here: 12.7% city: 1.1%
- Percentage of males in community and social services occupations:
Here: 4.6% city: 0.8%
- Percentage of males in legal occupations:
Here: 2.9% city: 0.8%
- Percentage of males in education, training, and library occupations:
Here: 4.9% city: 2.8%
- Percentage of males in arts, design, entertainment, sports, and media occupations:
Here: 4.1% city: 1.8%
- Percentage of males in healthcare practitioners and technical occupations:
Here: 2.9% city: 2.0%
- Percentage of males in service occupations:
Here: 8.9% city: 12.7%
- Percentage of males in sales and office occupations:
Here: 7.9% city: 12.8%
- Percentage of males in construction, extraction, and maintenance occupations:
Here: 10.8% city: 7.8%
- Percentage of males in transportation occupations:
Here: 6.2% city: 3.6%
- Percentage of males in material moving occupations:
Here: 1.7% city: 3.1%
Occupations of females:
- Percentage of females in management occupations (except farmers):
Here: 16.0% city: 11.0%
- Percentage of females in business and financial operations occupations:
Here: 3.4% city: 8.6%
- Percentage of females in computer and mathematical occupations:
Here: 2.8% city: 5.4%
- Percentage of females in architecture and engineering occupations:
Here: 1.1% city: 2.8%
- Percentage of females in life, physical, and social science occupations:
Here: 4.1% city: 1.7%
- Percentage of females in education, training, and library occupations:
Here: 19.4% city: 8.1%
- Percentage of females in arts, design, entertainment, sports, and media occupations:
Here: 1.7% city: 2.0%
- Percentage of females in healthcare practitioners and technical occupations:
Here: 8.6% city: 6.8%
- Percentage of females in service occupations:
Here: 12.8% city: 21.7%
- Percentage of females in sales and office occupations:
Here: 30.4% city: 22.0%
Percentage of people 16-64 in Armed Forces:
| Vermont (McKendrie): | 0.8% |
| San Jose: | 0.0% |
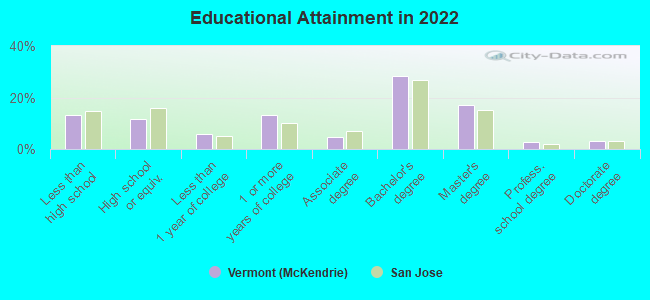
Education in this neighborhood (subdivision or community):
- Percentage of people 3 years and older in K-12 schools:
Vermont (McKendrie): 14.0% San Jose: 16.1%
- Percentage of people 3 years and older in undergraduate colleges:
Vermont (McKendrie): 4.0% San Jose: 6.5%
- Percentage of people 3 years and older in grad. or professional schools:
Vermont (McKendrie): 5.5% San Jose: 2.0%
- Percentage of students K-12 enrolled in private schools:
Vermont (McKendrie): 32.4% San Jose: 14.9%
Percentage of population below poverty level:
| Vermont (McKendrie): | 5.1% |
| San Jose: | 9.0% |
Median year owner moved in (as recorded in 2022):
Median year renter moved in (as recorded in 2022):
| Vermont (McKendrie): | 2007 |
| San Jose: | 2008 |
Median year renter moved in (as recorded in 2022):
| Vermont (McKendrie): | 2017 |
| San Jose: | 2020 |
Percentage of married-couple families with both working:
| Vermont (McKendrie): | 96.8% |
| San Jose: | 72.5% |
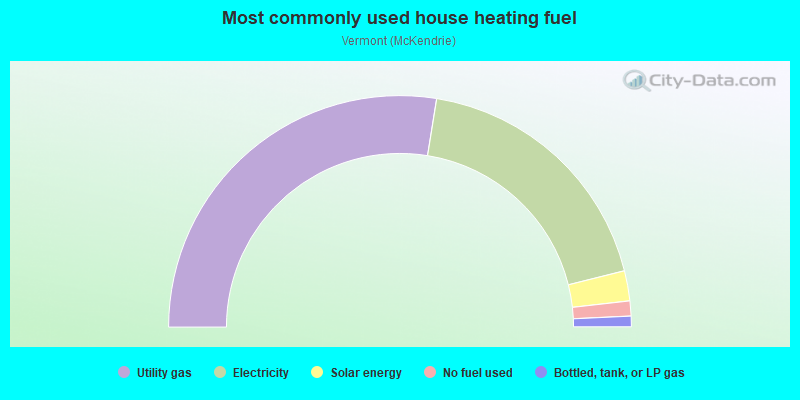
- 55.1%Utility gas
- 37.1%Electricity
- 4.2%Solar energy
- 2.1%No fuel used
- 1.5%Bottled, tank, or LP gas
Roads and streets:
W Hedding St
Length: 0.28 miles
Direction: SW-NE
Address range: 790 to 999
Direction: SW-NE
Address range: 790 to 999
Elm St
Length: 0.24 miles
Direction: SE-NW
Address range: 900 to 999
Direction: SE-NW
Address range: 900 to 999
Myrtle St
Length: 0.24 miles
Direction: SE-NW
Address range: 900 to 1049
Direction: SE-NW
Address range: 900 to 1049
Mc Kendrie St
Length: 0.22 miles
Direction: SW-NE
Address range: 800 to 999
Direction: SW-NE
Address range: 800 to 999
Vermont St
Length: 0.21 miles
Direction: SW-NE
Address range: 900 to 1099
Direction: SW-NE
Address range: 900 to 1099
Silicon Dr
Length: 0.05 miles
Directions: E-W, SW-NE
Address range: 900 to 999
Directions: E-W, SW-NE
Address range: 900 to 999
Railroad features:
Union Pacific RR
Length: 0.11 miles
Direction: SE-NW
Direction: SE-NW