Valley Industrial neighborhood in Woodinville, Washington (WA), 98011, 98072 detailed profile
Settings
X


Business Search - 14 Million verified businesses
Area: 0.510 square miles
Population: 677
Population density:
| Valley Industrial: | 1,328 people per square mile |
| Woodinville: | 2,358 people per square mile |

- 41037.4%White
- 36533.3%Some other race
- 11910.9%Asian
- 948.6%Hispanic or Latino
- 555.0%American Indian
- 302.7%Two or more races
- 191.7%Black
- 30.3%Native Hawaiian and Other
Pacific Islander

Median household income in 2022:
| Valley Industrial: | $148,177 |
| Woodinville: | $142,500 |
Distribution of median household income
![Distribution of median household income]()
- 9Less than $10,000
- 52$10,000 to $19,999
- 44$20,000 to $29,999
- 13$30,000 to $39,999
- 59$40,000 to $49,999
- 14$50,000 to $59,999
- 18$60,000 to $74,999
- 18$75,000 to $99,999
- 38$100,000 to $124,999
- 44$125,000 to $149,999
- 31$150,000 to $199,999
- 91$200,000 or more

Distribution of owner-occupied house/condo value
![Distribution of owner-occupied house/condo value]()
- 11Less than $50,000
- 28$50,000 to $99,999
- 82$150,000 to $199,999
- 28$200,000 to $249,999
- 11$250,000 to $299,999
- 9$300,000 to $399,999
- 17$400,000 to $499,999
- 59$500,000 to $749,999
- 53$750,000 to $999,999
- 130$1,000,000 or more

Distribution of rent paid by renters
![Distribution of rent paid by renters]()
- 15$200 to $299
- 16$500 to $599
- 26$600 to $699
- 18$700 to $799
- 8$800 to $899
- 27$1,000 to $1,249
- 14$1,250 to $1,499
- 233$1,500 to $1,999
- 182$2,000 or more

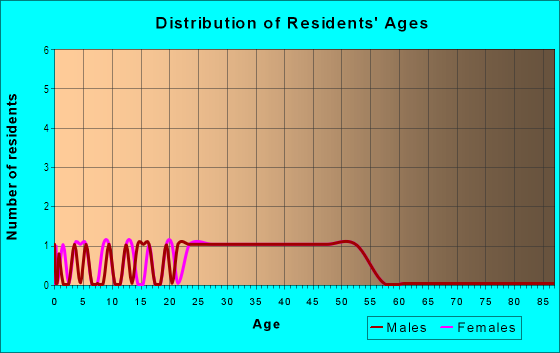
| Males: | 366 |
| Females: | 311 |
Males:
| This neighborhood: | 38.5 years |
| Whole city: | 40.3 years |
| This neighborhood: | 39.5 years |
| Whole city: | 41.1 years |
Average household size:
| Valley Industrial: | 3.9 people |
| Woodinville: | 2.4 people |
Percentage of family households:
| Valley Industrial: | 52.8% |
| Woodinville: | 47.2% |
| Here: | 54.2% |
| Woodinville: | 55.0% |
Percentage of married-couple families with children (among all households):
| Valley Industrial: | 36.3% |
| Woodinville: | 35.3% |
Percentage of single-mother households (among all households):
| Valley Industrial: | 13.5% |
| Woodinville: | 5.8% |
Percentage of never married males 15 years old and over:
Percentage of never married females 15 years old and over:
| Valley Industrial: | 16.6% |
| Woodinville: | 12.7% |
Percentage of never married females 15 years old and over:
| Valley Industrial: | 11.0% |
| city: | 13.9% |
Percentage of people that speak English not well or not at all:
| Valley Industrial: | 2.0% |
| Woodinville: | 1.8% |
Percentage of people born in this state:
Percentage of people born in another U.S. state:
Percentage of native residents but born outside the U.S.:
Percentage of foreign born residents:
| Here: | 39.5% |
| Woodinville: | 38.6% |
Percentage of people born in another U.S. state:
| Valley Industrial: | 29.2% |
| Woodinville: | 35.2% |
Percentage of native residents but born outside the U.S.:
| Here: | 1.4% |
| city: | 1.7% |
Percentage of foreign born residents:
| Here: | 29.9% |
| Woodinville: | 24.6% |

Owner-occupied
Renter-occupied


- Rooms in owner-occupied houses and condos in Valley Industrial
- 221 room
- 152 rooms
- 203 rooms
- 214 rooms
- 325 rooms
- 216 rooms
- 267 rooms
- 188 rooms
- 549+ rooms

- Rooms in renter-occupied apartments in Valley Industrial
- 251 room
- 692 rooms
- 263 rooms
- 154 rooms
- 1385 rooms
- 766 rooms
- 147 rooms
- 48 rooms
- 129+ rooms
Owner-occupied
Renter-occupied

- Bedrooms in owner-occupied houses and condos in Valley Industrial
- 22no bedroom
- 161 bedroom
- 512 bedrooms
- 543 bedrooms
- 744 bedrooms
- 125+ bedrooms

- Bedrooms in renter-occupied apartments in Valley Industrial
- 25no bedroom
- 1621 bedroom
- 542 bedrooms
- 203 bedrooms
- 124 bedrooms
- 75+ bedrooms
Average number of cars or other vehicles available in houses/condos:
Average number of cars or other vehicles available in apartments:
| This neighborhood: | |
| Woodinville: |
Average number of cars or other vehicles available in apartments:
| Here: | 1.7 |
| city: | 1.3 |
Percentage of units with a mortgage:
| Valley Industrial: | 70.2% |
| Woodinville: | 74.2% |

- Year house built in Valley Industrial
- 22020 or later
- 92010 to 2019
- 622000 to 2009
- 1101990 to 1999
- 1141980 to 1989
- 61970 to 1979
- 141960 to 1969
- 21950 to 1959
- 31940 to 1949
- 111939 or earlier

City-data.com crime index for city in 2020 (higher means more crime):
| City: | 176.1 |
| U.S. average: | 219.5 |
Travel time to work (commute)
![Travel time to work (commute)]()
- 5Less than 5 minutes
- 495 to 9 minutes
- 3410 to 14 minutes
- 3715 to 19 minutes
- 10320 to 24 minutes
- 7725 to 29 minutes
- 7230 to 34 minutes
- 1935 to 39 minutes
- 2540 to 44 minutes
- 1345 to 59 minutes
- 6260 to 89 minutes
- 1090 or more minutes

Means of transportation to work
![Means of transportation to work]()
- 60.9%231Drove a car alone
- 2.6%10Carpooled
- 4.7%18Bus
- 2.1%8Subway or elevated rail
- 5.3%20Bicycle
- 4.7%18Walked
- 1.8%7Other means
- 29.8%113Worked at home

Time leaving home to go to work
![Time leaving home to go to work]()
- 912:00 a.m. to 4:59 a.m.
- 105:00 a.m. to 5:29 a.m.
- 155:30 a.m. to 5:59 a.m.
- 406:00 a.m. to 6:29 a.m.
- 716:30 a.m. to 6:59 a.m.
- 587:00 a.m. to 7:29 a.m.
- 927:30 a.m. to 7:59 a.m.
- 538:00 a.m. to 8:29 a.m.
- 538:30 a.m. to 8:59 a.m.
- 559:00 a.m. to 9:59 a.m.
- 2510:00 a.m. to 10:59 a.m.
- 911:00 a.m. to 11:59 a.m.
- 1512:00 p.m. to 3:59 p.m.
- 244:00 p.m. to 11:59 p.m.

Occupations of males:
- Percentage of males in management occupations (except farmers):
Here: 22.5% city: 21.0%
- Percentage of males in business and financial operations occupations:
Here: 11.4% city: 4.5%
- Percentage of males in computer and mathematical occupations:
Here: 19.4% city: 23.8%
- Percentage of males in architecture and engineering occupations:
Here: 7.3% city: 7.4%
- Percentage of males in life, physical, and social science occupations:
Here: 2.3% city: 1.5%
- Percentage of males in education, training, and library occupations:
Here: 1.9% city: 1.6%
- Percentage of males in arts, design, entertainment, sports, and media occupations:
Here: 1.2% city: 2.2%
- Percentage of males in service occupations:
Here: 10.5% city: 7.0%
- Percentage of males in sales and office occupations:
Here: 7.5% city: 13.1%
- Percentage of males in construction, extraction, and maintenance occupations:
Here: 7.6% city: 2.4%
- Percentage of males in production occupations:
Here: 1.6% city: 3.9%
- Percentage of males in transportation occupations:
Here: 1.8% city: 1.5%
- Percentage of males in material moving occupations:
Here: 1.8% city: 4.0%
Occupations of females:
- Percentage of females in management occupations (except farmers):
Here: 19.4% city: 18.7%
- Percentage of females in business and financial operations occupations:
Here: 12.2% city: 14.2%
- Percentage of females in computer and mathematical occupations:
Here: 4.6% city: 3.6%
- Percentage of females in life, physical, and social science occupations:
Here: 2.4% city: 0.8%
- Percentage of females in community and social services occupations:
Here: 3.5% city: 2.2%
- Percentage of females in legal occupations:
Here: 3.0% city: 1.5%
- Percentage of females in education, training, and library occupations:
Here: 8.6% city: 6.6%
- Percentage of females in arts, design, entertainment, sports, and media occupations:
Here: 1.1% city: 4.1%
- Percentage of females in healthcare practitioners and technical occupations:
Here: 5.2% city: 11.1%
- Percentage of females in service occupations:
Here: 16.1% city: 6.5%
- Percentage of females in sales and office occupations:
Here: 20.5% city: 26.5%
- Percentage of females in transportation occupations:
Here: 2.6% city: 1.0%
- Percentage of females in material moving occupations:
Here: 3.2% city: 0.7%
Education in this neighborhood (subdivision or community):
- Percentage of people 3 years and older in K-12 schools:
Valley Industrial: 27.5% Woodinville: 12.1%
- Percentage of people 3 years and older in undergraduate colleges:
Valley Industrial: 4.5% Woodinville: 5.3%
- Percentage of people 3 years and older in grad. or professional schools:
Valley Industrial: 10.4% Woodinville: 1.8%
- Percentage of students K-12 enrolled in private schools:
Valley Industrial: 41.5% Woodinville: 12.5%
Percentage of population below poverty level:
| Valley Industrial: | 6.0% |
| Woodinville: | 3.8% |
Percentage of married-couple families with both working:
| Valley Industrial: | 95.9% |
| Woodinville: | 74.0% |

- 54.1%Electricity
- 35.4%Utility gas
- 3.9%Bottled, tank, or LP gas
- 3.0%Fuel oil, kerosene, etc.
- 2.3%Wood
- 1.3%No fuel used
Highways in this neighborhood:
State Hwy 522
Length: 1.61 miles
Direction: E-W
Direction: E-W
State Rte 202 (Woodinville Redmond Rd NE)
Length: 1.60 miles
Direction: SE-NW
Address range: 14986 to 17499
Direction: SE-NW
Address range: 14986 to 17499
131st Ave NE (State Rte 202)
Length: 0.25 miles
Directions: N-S, SW-NE
Address range: 17600 to 17737
Directions: N-S, SW-NE
Address range: 17600 to 17737
NE 175th St (State Rte 202)
Length: 0.21 miles
Directions: E-W, SW-NE
Address range: 12820 to 12969
Directions: E-W, SW-NE
Address range: 12820 to 12969
Roads and streets:
Sammamish River Trl
Length: 0.59 miles
Directions: E-W, N-S, SE-NW
Directions: E-W, N-S, SE-NW
Woodinville Dr (NE Woodinville Dr)
Length: 0.47 miles
Directions: E-W, SE-NW
Address range: 12241 to 12799
Directions: E-W, SE-NW
Address range: 12241 to 12799
NE 180th St
Length: 0.38 miles
Direction: E-W
Address range: 12600 to 12955
Direction: E-W
Address range: 12600 to 12955
NE 178th St
Length: 0.35 miles
Directions: E-W, SE-NW
Address range: 12600 to 12949
Directions: E-W, SE-NW
Address range: 12600 to 12949
NE 150th St
Length: 0.34 miles
Direction: E-W
Address range: 13936 to 13999
Direction: E-W
Address range: 13936 to 13999
130th Ave NE
Length: 0.12 miles
Directions: E-W, N-S, SE-NW, SW-NE
Address range: 17600 to 17899
Directions: E-W, N-S, SE-NW, SW-NE
Address range: 17600 to 17899
NE 177th St
Length: 0.05 miles
Directions: E-W, SE-NW
Address range: 13000 to 13099
Directions: E-W, SE-NW
Address range: 13000 to 13099
Railroad features:
Burlington Northern Santa Fe Rlwy
Length: 2.80 miles
Directions: E-W, N-S, SE-NW, SW-NE
Directions: E-W, N-S, SE-NW, SW-NE
Other features:
Sammamish Riv
Length: 1.99 miles
Directions: E-W, SE-NW, SW-NE
Directions: E-W, SE-NW, SW-NE
Little Bear Crk
Length: 0.39 miles
Directions: E-W, N-S, SW-NE
Directions: E-W, N-S, SW-NE