Upsala neighborhood in East Orange, New Jersey (NJ), 07017 detailed profile
Settings
X


Business Search - 14 Million verified businesses
Area: 0.038 square miles
Population: 337
Population density:
| Upsala: | 8,869 people per square mile |
| East Orange: | 17,426 people per square mile |

- 26779.0%Black
- 339.8%Hispanic or Latino
- 236.8%Two or more races
- 72.1%Some other race
- 61.8%American Indian
- 20.6%White

Median household income in 2022:
| Upsala: | $69,816 |
| East Orange: | $43,527 |
Distribution of median household income
![Distribution of median household income]()
- 11Less than $10,000
- 30$10,000 to $19,999
- 12$20,000 to $29,999
- 13$30,000 to $39,999
- 8$40,000 to $49,999
- 5$50,000 to $59,999
- 13$60,000 to $74,999
- 19$75,000 to $99,999
- 9$100,000 to $124,999
- 12$125,000 to $149,999
- 9$150,000 to $199,999
- 8$200,000 or more

Distribution of owner-occupied house/condo value
![Distribution of owner-occupied house/condo value]()
- 20Less than $50,000
- 19$100,000 to $149,999
- 10$150,000 to $199,999
- 9$200,000 to $249,999
- 13$250,000 to $299,999
- 12$300,000 to $399,999
- 6$400,000 to $499,999
- 10$500,000 to $749,999
- 16$750,000 to $999,999

Distribution of rent paid by renters
![Distribution of rent paid by renters]()
- 5$100 to $199
- 22$200 to $299
- 5$300 to $399
- 6$700 to $799
- 13$800 to $899
- 5$900 to $999
- 5$1,000 to $1,249
- 23$1,250 to $1,499
- 22$1,500 to $1,999
- 4$2,000 or more

Median rent in 2022:
| Upsala: | $1,446 |
| East Orange: | $1,074 |
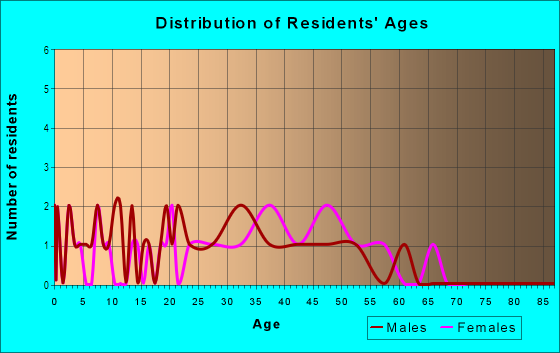
| Males: | 140 |
| Females: | 196 |
Males:
| This neighborhood: | 41.7 years |
| Whole city: | 34.0 years |
| This neighborhood: | 34.1 years |
| Whole city: | 39.2 years |
Average household size:
| Upsala: | 13.3 people |
| East Orange: | 2.4 people |
Percentage of family households:
| Upsala: | 49.7% |
| East Orange: | 35.5% |
| Here: | 18.1% |
| East Orange: | 21.9% |
Percentage of married-couple families with children (among all households):
| Upsala: | 0.7% |
| East Orange: | 17.7% |
Percentage of single-mother households (among all households):
| Upsala: | 19.8% |
| East Orange: | 19.1% |
Percentage of never married males 15 years old and over:
Percentage of never married females 15 years old and over:
| Upsala: | 24.6% |
| East Orange: | 27.1% |
Percentage of never married females 15 years old and over:
| Upsala: | 28.6% |
| city: | 26.2% |
Percentage of people that speak English not well or not at all:
| Upsala: | 1.3% |
| East Orange: | 4.0% |
Percentage of people born in this state:
Percentage of people born in another U.S. state:
Percentage of native residents but born outside the U.S.:
Percentage of foreign born residents:
| Here: | 57.7% |
| East Orange: | 44.2% |
Percentage of people born in another U.S. state:
| Upsala: | 23.4% |
| East Orange: | 18.0% |
Percentage of native residents but born outside the U.S.:
| Here: | 1.2% |
| city: | 2.4% |
Percentage of foreign born residents:
| Here: | 17.8% |
| East Orange: | 35.4% |

Owner-occupied
Renter-occupied


- Rooms in owner-occupied houses and condos in Upsala
- 11 room
- 162 rooms
- 13 rooms
- 44 rooms
- 235 rooms
- 76 rooms
- 47 rooms
- 38 rooms
- 169+ rooms

- Rooms in renter-occupied apartments in Upsala
- 41 room
- 42 rooms
- 433 rooms
- 194 rooms
- 205 rooms
- 86 rooms
- 67 rooms
- 28 rooms
- 39+ rooms
Owner-occupied
Renter-occupied

- Bedrooms in owner-occupied houses and condos in Upsala
- 1no bedroom
- 181 bedroom
- 132 bedrooms
- 173 bedrooms
- 174 bedrooms
- 125+ bedrooms

- Bedrooms in renter-occupied apartments in Upsala
- 4no bedroom
- 41 bedroom
- 362 bedrooms
- 93 bedrooms
- 34 bedrooms
- 05+ bedrooms
Average number of cars or other vehicles available in houses/condos:
Average number of cars or other vehicles available in apartments:
| This neighborhood: | 2.1 |
| East Orange: | 1.9 |
Average number of cars or other vehicles available in apartments:
| Here: | 0.9 |
| city: | 0.7 |
Percentage of units with a mortgage:
| Upsala: | 84.5% |
| East Orange: | 72.5% |
Housing prices:
- Average estimated value of detached houses in 2022 (27.9% of all units):
Upsala: $288,428 East Orange: $351,364
- Average estimated value of townhouses or other attached units in 2022 (4.1% of all units):
This neighborhood: $259,707 city: $385,266
- Average estimated value of housing units in 2-unit structures in 2022 (31.1% of all units):
This neighborhood: $471,177 East Orange: $450,324
- Average estimated '22 value of housing units in 3-to-4-unit structures (18.9% of all units):
Upsala: $83,981 city: $280,701

- Year house built in Upsala
- 02020 or later
- 52010 to 2019
- 72000 to 2009
- 11990 to 1999
- 71980 to 1989
- 41970 to 1979
- 31960 to 1969
- 291950 to 1959
- 181940 to 1949
- 521939 or earlier

City-data.com crime index for city in 2020 (higher means more crime):
| City: | 201.2 |
| U.S. average: | 219.5 |
Travel time to work (commute)
![Travel time to work (commute)]()
- 19Less than 5 minutes
- 25 to 9 minutes
- 2010 to 14 minutes
- 1715 to 19 minutes
- 1820 to 24 minutes
- 425 to 29 minutes
- 1630 to 34 minutes
- 1035 to 39 minutes
- 240 to 44 minutes
- 845 to 59 minutes
- 1660 to 89 minutes
- 490 or more minutes

Means of transportation to work
![Means of transportation to work]()
- 52.1%87Drove a car alone
- 6.6%11Carpooled
- 16.2%27Bus
- 1.8%3Subway or elevated rail
- 2.4%4Long-distance train or commuter rail
- 8.4%14Light rail, streetcar or trolley
- 4.2%7Taxi
- 7.2%12Bicycle
- 17.4%29Walked
- 3.0%5Other means
- 15.6%26Worked at home

Time leaving home to go to work
![Time leaving home to go to work]()
- 112:00 a.m. to 4:59 a.m.
- 55:00 a.m. to 5:29 a.m.
- 45:30 a.m. to 5:59 a.m.
- 66:00 a.m. to 6:29 a.m.
- 126:30 a.m. to 6:59 a.m.
- 217:00 a.m. to 7:29 a.m.
- 167:30 a.m. to 7:59 a.m.
- 188:00 a.m. to 8:29 a.m.
- 128:30 a.m. to 8:59 a.m.
- 39:00 a.m. to 9:59 a.m.
- 310:00 a.m. to 10:59 a.m.
- 1912:00 p.m. to 3:59 p.m.
- 64:00 p.m. to 11:59 p.m.

Occupations of males:
- Percentage of males in management occupations (except farmers):
Here: 4.2% city: 6.9%
- Percentage of males in business and financial operations occupations:
Here: 2.2% city: 4.1%
- Percentage of males in computer and mathematical occupations:
Here: 2.1% city: 2.9%
- Percentage of males in architecture and engineering occupations:
Here: 2.7% city: 3.3%
- Percentage of males in education, training, and library occupations:
Here: 4.0% city: 2.2%
- Percentage of males in service occupations:
Here: 11.0% city: 21.2%
- Percentage of males in sales and office occupations:
Here: 33.6% city: 16.5%
- Percentage of males in farming, fishing, and forestry occupations:
Here: 2.3% city: 0.1%
- Percentage of males in construction, extraction, and maintenance occupations:
Here: 10.6% city: 6.4%
- Percentage of males in production occupations:
Here: 10.6% city: 4.7%
- Percentage of males in transportation occupations:
Here: 3.8% city: 12.2%
- Percentage of males in material moving occupations:
Here: 19.0% city: 10.6%
Occupations of females:
- Percentage of females in management occupations (except farmers):
Here: 7.7% city: 6.5%
- Percentage of females in business and financial operations occupations:
Here: 27.5% city: 5.7%
- Percentage of females in community and social services occupations:
Here: 2.1% city: 4.4%
- Percentage of females in legal occupations:
Here: 3.5% city: 0.6%
- Percentage of females in education, training, and library occupations:
Here: 6.7% city: 6.6%
- Percentage of females in healthcare practitioners and technical occupations:
Here: 5.7% city: 6.6%
- Percentage of females in service occupations:
Here: 14.6% city: 32.6%
- Percentage of females in sales and office occupations:
Here: 29.3% city: 27.4%
- Percentage of females in production occupations:
Here: 3.3% city: 1.1%
- Percentage of females in transportation occupations:
Here: 2.1% city: 2.5%
- Percentage of females in material moving occupations:
Here: 5.3% city: 3.3%
Percentage of people 16-64 in Armed Forces:
| Upsala: | 0.1% |
| East Orange: | 0.1% |
Education in this neighborhood (subdivision or community):
- Percentage of people 3 years and older in K-12 schools:
Upsala: 15.2% East Orange: 19.7%
- Percentage of people 3 years and older in undergraduate colleges:
Upsala: 9.0% East Orange: 7.0%
- Percentage of people 3 years and older in grad. or professional schools:
Upsala: 4.0% East Orange: 0.4%
- Percentage of students K-12 enrolled in private schools:
Upsala: 6.1% East Orange: 11.6%
Percentage of population below poverty level:
| Upsala: | 9.2% |
| East Orange: | 22.1% |
Median year renter moved in (as recorded in 2022):
| Upsala: | 2016 |
| East Orange: | 2016 |
Percentage of married-couple families with both working:
| Upsala: | 461.3% |
| East Orange: | 72.4% |

- 51.5%Utility gas
- 21.1%Electricity
- 13.4%Bottled, tank, or LP gas
- 9.7%No fuel used
- 2.6%Other fuel
- 1.7%Fuel oil, kerosene, etc.
Roads and streets:
Woodland Ave
Length: 0.38 miles
Directions: E-W, SE-NW, SW-NE
Address range: 155 to 242
Directions: E-W, SE-NW, SW-NE
Address range: 155 to 242
Upsala Ct
Length: 0.12 miles
Direction: SE-NW
Address range: 3 to 40
Direction: SE-NW
Address range: 3 to 40
College Ave
Length: 0.12 miles
Directions: N-S, SW-NE
Address range: 20 to 40
Directions: N-S, SW-NE
Address range: 20 to 40
Fernwood Rd
Length: 0.04 miles
Direction: SE-NW
Direction: SE-NW