Twenty Ninth Street neighborhood in Boulder, Colorado (CO), 80301 detailed profile
Settings
X


Business Search - 14 Million verified businesses
Area: 0.144 square miles
Population: 1,451
Population density:
| Twenty Ninth Street: | 10,073 people per square mile |
| Boulder: | 4,328 people per square mile |

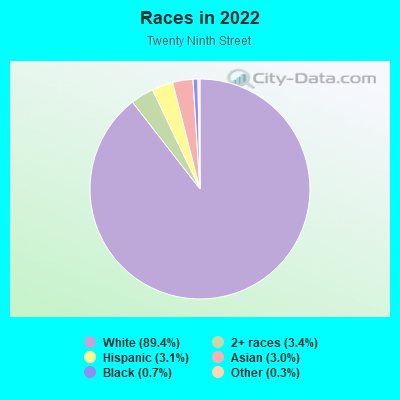
- 1,29589.4%White
- 493.4%Two or more races
- 453.1%Hispanic or Latino
- 443.0%Asian
- 100.7%Black
- 50.3%Some other race
Distribution of median household income
![Distribution of median household income]()
- 205Less than $10,000
- 112$10,000 to $19,999
- 16$20,000 to $29,999
- 27$30,000 to $39,999
- 42$40,000 to $49,999
- 40$50,000 to $59,999
- 34$60,000 to $74,999
- 63$75,000 to $99,999
- 56$100,000 to $124,999
- 26$150,000 to $199,999
- 38$200,000 or more

Distribution of owner-occupied house/condo value
![Distribution of owner-occupied house/condo value]()
- 25$300,000 to $399,999
- 6$400,000 to $499,999
- 43$500,000 to $749,999
- 3$750,000 to $999,999

Distribution of rent paid by renters
![Distribution of rent paid by renters]()
- 4$600 to $699
- 47$1,000 to $1,249
- 32$1,250 to $1,499
- 206$1,500 to $1,999
- 268$2,000 or more

Median rent in 2022:
| Twenty Ninth Street: | $1,966 |
| Boulder: | $1,700 |
| Males: | 908 |
| Females: | 542 |
Males:
| This neighborhood: | 23.1 years |
| Whole city: | 28.3 years |
| This neighborhood: | 21.4 years |
| Whole city: | 29.2 years |
Average household size:
| Twenty Ninth Street: | 2.4 people |
| Boulder: | 2.1 people |
Percentage of family households:
| Twenty Ninth Street: | 3.9% |
| Boulder: | 26.9% |
| Here: | 4.3% |
| Boulder: | 30.4% |
Percentage of married-couple families with children (among all households):
| Twenty Ninth Street: | 43.5% |
| Boulder: | 32.8% |
Percentage of single-mother households (among all households):
| Twenty Ninth Street: | 3.4% |
| Boulder: | 6.3% |
Percentage of never married males 15 years old and over:
Percentage of never married females 15 years old and over:
| Twenty Ninth Street: | 58.3% |
| Boulder: | 32.7% |
Percentage of never married females 15 years old and over:
| Twenty Ninth Street: | 33.1% |
| city: | 28.3% |
Percentage of people that speak English not well or not at all:
| Twenty Ninth Street: | 0.0% |
| Boulder: | 1.0% |
Percentage of people born in this state:
Percentage of people born in another U.S. state:
Percentage of native residents but born outside the U.S.:
Percentage of foreign born residents:
| Here: | 32.4% |
| Boulder: | 28.3% |
Percentage of people born in another U.S. state:
| Twenty Ninth Street: | 45.2% |
| Boulder: | 60.5% |
Percentage of native residents but born outside the U.S.:
| Here: | 4.2% |
| city: | 2.1% |
Percentage of foreign born residents:
| Here: | 18.2% |
| Boulder: | 9.1% |
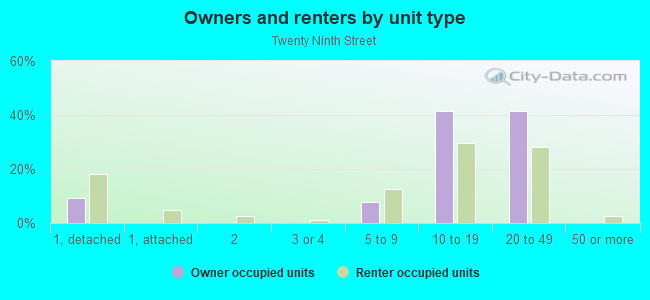
Owner-occupied
Renter-occupied

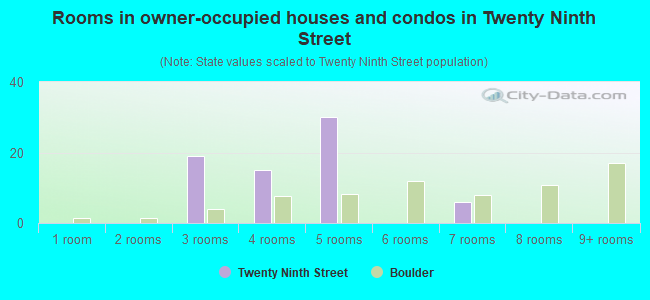
- Rooms in owner-occupied houses and condos in Twenty Ninth Street
- 01 room
- 02 rooms
- 193 rooms
- 154 rooms
- 305 rooms
- 06 rooms
- 67 rooms
- 08 rooms
- 09+ rooms
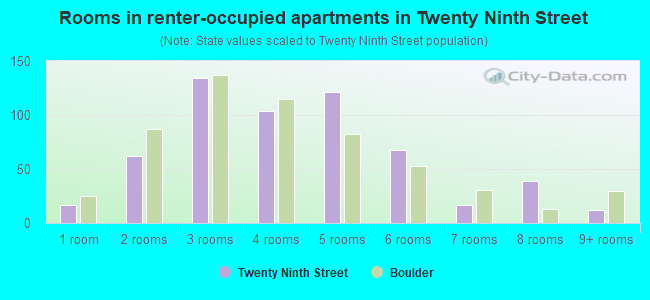
- Rooms in renter-occupied apartments in Twenty Ninth Street
- 171 room
- 622 rooms
- 1343 rooms
- 1044 rooms
- 1215 rooms
- 686 rooms
- 177 rooms
- 398 rooms
- 129+ rooms
Owner-occupied
Renter-occupied
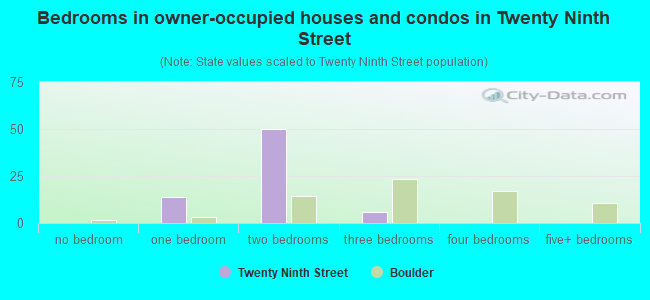
- Bedrooms in owner-occupied houses and condos in Twenty Ninth Street
- 0no bedroom
- 141 bedroom
- 502 bedrooms
- 63 bedrooms
- 04 bedrooms
- 05+ bedrooms
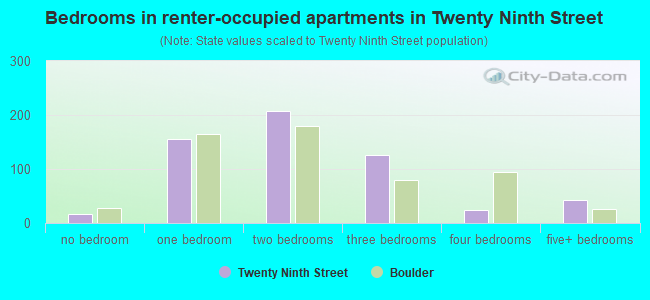
- Bedrooms in renter-occupied apartments in Twenty Ninth Street
- 17no bedroom
- 1551 bedroom
- 2082 bedrooms
- 1263 bedrooms
- 244 bedrooms
- 425+ bedrooms
Average number of cars or other vehicles available in houses/condos:
Average number of cars or other vehicles available in apartments:
| This neighborhood: | |
| Boulder: |
Average number of cars or other vehicles available in apartments:
| Here: | 1.7 |
| city: | 1.6 |
Percentage of units with a mortgage:
| Twenty Ninth Street: | 65.5% |
| Boulder: | 60.5% |
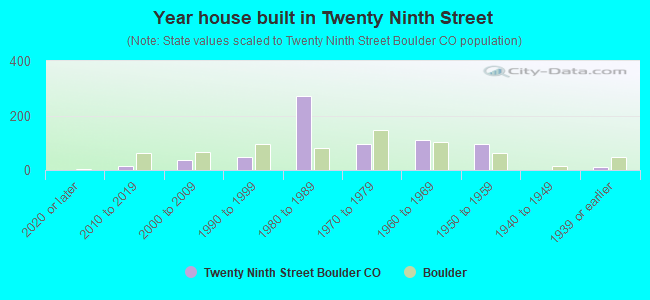
- Year house built in Twenty Ninth Street
- 02020 or later
- 152010 to 2019
- 352000 to 2009
- 461990 to 1999
- 2711980 to 1989
- 951970 to 1979
- 1111960 to 1969
- 941950 to 1959
- 01940 to 1949
- 121939 or earlier
City-data.com crime index for city in 2020 (higher means more crime):
| City: | 275.1 |
| U.S. average: | 219.5 |
Travel time to work (commute)
![Travel time to work (commute)]()
- 185 to 9 minutes
- 4910 to 14 minutes
- 2815 to 19 minutes
- 1820 to 24 minutes
- 930 to 34 minutes
- 335 to 39 minutes
- 140 to 44 minutes
- 1345 to 59 minutes
- 360 to 89 minutes

Means of transportation to work
![Means of transportation to work]()
- 19.9%140Drove a car alone
- 3.8%27Carpooled
- 5.5%39Bus
- 11.1%78Bicycle
- 24.1%170Walked
- 0.3%2Other means
- 35.2%248Worked at home

Time leaving home to go to work
![Time leaving home to go to work]()
- 112:00 a.m. to 4:59 a.m.
- 45:30 a.m. to 5:59 a.m.
- 56:30 a.m. to 6:59 a.m.
- 97:00 a.m. to 7:29 a.m.
- 167:30 a.m. to 7:59 a.m.
- 178:00 a.m. to 8:29 a.m.
- 98:30 a.m. to 8:59 a.m.
- 379:00 a.m. to 9:59 a.m.
- 910:00 a.m. to 10:59 a.m.
- 1211:00 a.m. to 11:59 a.m.
- 412:00 p.m. to 3:59 p.m.
- 84:00 p.m. to 11:59 p.m.

Occupations of males:
- Percentage of males in management occupations (except farmers):
Here: 8.8% city: 12.9%
- Percentage of males in business and financial operations occupations:
Here: 8.8% city: 7.6%
- Percentage of males in computer and mathematical occupations:
Here: 15.2% city: 10.0%
- Percentage of males in architecture and engineering occupations:
Here: 11.2% city: 6.1%
- Percentage of males in life, physical, and social science occupations:
Here: 3.1% city: 6.1%
- Percentage of males in legal occupations:
Here: 1.6% city: 2.1%
- Percentage of males in education, training, and library occupations:
Here: 15.5% city: 8.1%
- Percentage of males in arts, design, entertainment, sports, and media occupations:
Here: 2.4% city: 3.3%
- Percentage of males in service occupations:
Here: 18.1% city: 14.4%
- Percentage of males in sales and office occupations:
Here: 8.0% city: 14.5%
- Percentage of males in production occupations:
Here: 3.5% city: 2.3%
Occupations of females:
- Percentage of females in management occupations (except farmers):
Here: 1.8% city: 8.8%
- Percentage of females in business and financial operations occupations:
Here: 11.3% city: 6.4%
- Percentage of females in computer and mathematical occupations:
Here: 5.5% city: 4.6%
- Percentage of females in architecture and engineering occupations:
Here: 6.2% city: 1.9%
- Percentage of females in life, physical, and social science occupations:
Here: 5.7% city: 4.7%
- Percentage of females in education, training, and library occupations:
Here: 30.2% city: 13.1%
- Percentage of females in service occupations:
Here: 19.0% city: 20.9%
- Percentage of females in sales and office occupations:
Here: 20.3% city: 19.4%
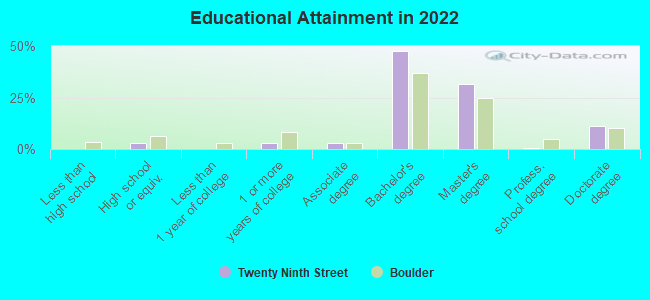
Education in this neighborhood (subdivision or community):
- Percentage of people 3 years and older in K-12 schools:
Twenty Ninth Street: 1.3% Boulder: 8.8%
- Percentage of people 3 years and older in undergraduate colleges:
Twenty Ninth Street: 66.4% Boulder: 28.2%
- Percentage of people 3 years and older in grad. or professional schools:
Twenty Ninth Street: 10.5% Boulder: 6.1%
- Percentage of students K-12 enrolled in private schools:
Twenty Ninth Street: 0.0% Boulder: 8.5%
Percentage of population below poverty level:
| Twenty Ninth Street: | 48.7% |
| Boulder: | 24.1% |
Median year renter moved in (as recorded in 2022):
| Twenty Ninth Street: | 2020 |
| Boulder: | 2022 |
Percentage of married-couple families with both working:
| Twenty Ninth Street: | 91.4% |
| Boulder: | 76.2% |
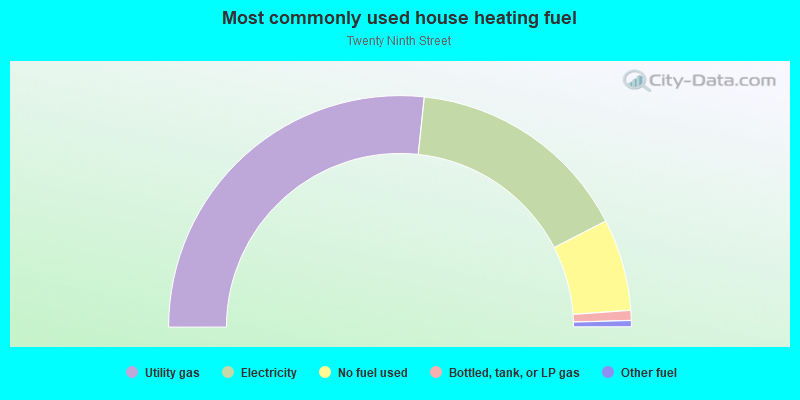
- 53.3%Utility gas
- 31.5%Electricity
- 12.8%No fuel used
- 1.4%Bottled, tank, or LP gas
- 0.9%Other fuel
Highways in this neighborhood:
State Hwy 7 (Arapahoe Ave)
Length: 0.55 miles
Direction: E-W
Address range: 2827 to 2991
Direction: E-W
Address range: 2827 to 2991
Roads and streets:
30th St
Length: 1.19 miles
Direction: N-S
Address range: 1601 to 2229
Direction: N-S
Address range: 1601 to 2229
Walnut St
Length: 0.30 miles
Directions: E-W, N-S, SE-NW, SW-NE
Directions: E-W, N-S, SE-NW, SW-NE
Other features:
Lefthand Ditch
Length: 0.01 miles
Direction: E-W
Direction: E-W