The Woodlands (Woodlands) neighborhood in Horsham, Pennsylvania (PA), 19044 detailed profile
Settings
X

Business Search - 14 Million verified businesses
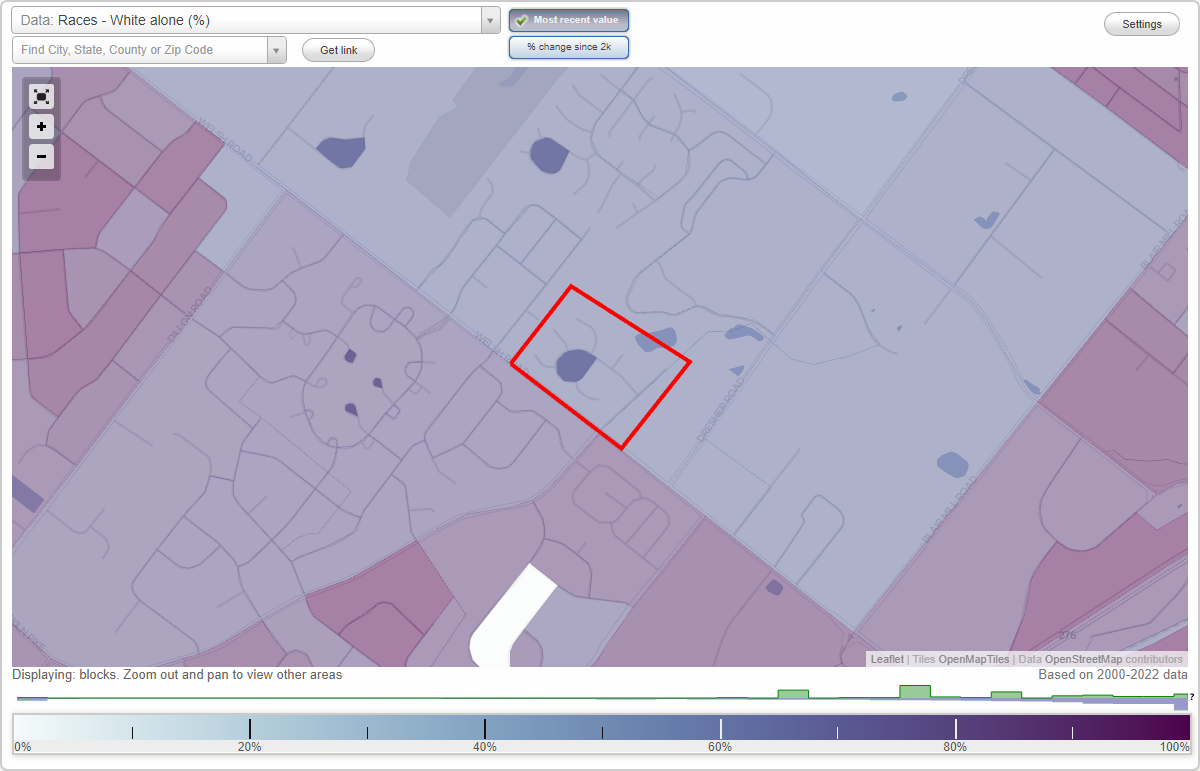
Area: 0.075 square miles
Population: 137
Population density:
| The Woodlands (Woodlands): | 1,829 people per square mile |
| Horsham: | 2,870 people per square mile |

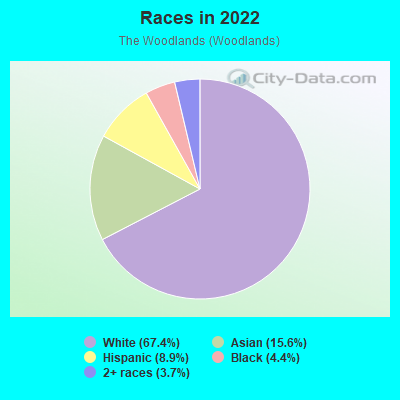
- 9167.4%White
- 2115.6%Asian
- 128.9%Hispanic or Latino
- 64.4%Black
- 53.7%Two or more races
Median household income in 2022:
| The Woodlands (Woodlands): | $120,000 |
| Horsham: | $96,284 |
Distribution of median household income
![Distribution of median household income]()
- 3$10,000 to $19,999
- 3$20,000 to $29,999
- 2$30,000 to $39,999
- 3$40,000 to $49,999
- 3$50,000 to $59,999
- 8$60,000 to $74,999
- 6$75,000 to $99,999
- 6$100,000 to $124,999
- 7$125,000 to $149,999
- 6$150,000 to $199,999
- 14$200,000 or more

Distribution of owner-occupied house/condo value
![Distribution of owner-occupied house/condo value]()
- 2Less than $50,000
- 2$150,000 to $199,999
- 10$200,000 to $249,999
- 11$250,000 to $299,999
- 10$300,000 to $399,999
- 5$400,000 to $499,999
- 8$500,000 to $749,999
- 2$750,000 to $999,999
- 1$1,000,000 or more

Distribution of rent paid by renters
![Distribution of rent paid by renters]()
- 2$800 to $899
- 2$1,250 to $1,499
- 4$1,500 to $1,999
- 2$2,000 or more

Median rent in 2022:
| The Woodlands (Woodlands): | $1,703 |
| Horsham: | $1,171 |
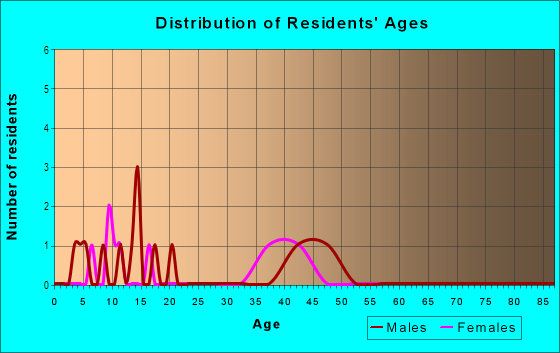
| Males: | 60 |
| Females: | 76 |
Males:
| This neighborhood: | 36.3 years |
| Whole city: | 35.9 years |
| This neighborhood: | 38.8 years |
| Whole city: | 35.0 years |
Average household size:
| The Woodlands (Woodlands): | 2.5 people |
| Horsham: | 2.7 people |
Percentage of family households:
| The Woodlands (Woodlands): | 50.1% |
| Horsham: | 52.7% |
| Here: | 48.9% |
| Horsham: | 50.6% |
Percentage of married-couple families with children (among all households):
| The Woodlands (Woodlands): | 30.3% |
| Horsham: | 25.6% |
Percentage of single-mother households (among all households):
| The Woodlands (Woodlands): | 6.0% |
| Horsham: | 6.7% |
Percentage of never married males 15 years old and over:
Percentage of never married females 15 years old and over:
| The Woodlands (Woodlands): | 11.9% |
| Horsham: | 16.0% |
Percentage of never married females 15 years old and over:
| The Woodlands (Woodlands): | 16.2% |
| place: | 17.2% |
Percentage of people that speak English not well or not at all:
| The Woodlands (Woodlands): | 0.8% |
| Horsham: | 2.8% |
Percentage of people born in this state:
Percentage of people born in another U.S. state:
Percentage of native residents but born outside the U.S.:
Percentage of foreign born residents:
| Here: | 63.2% |
| Horsham: | 67.5% |
Percentage of people born in another U.S. state:
| The Woodlands (Woodlands): | 17.9% |
| Horsham: | 15.4% |
Percentage of native residents but born outside the U.S.:
| Here: | 2.1% |
| place: | 1.1% |
Percentage of foreign born residents:
| Here: | 16.8% |
| Horsham: | 16.1% |
Owner-occupied
Renter-occupied

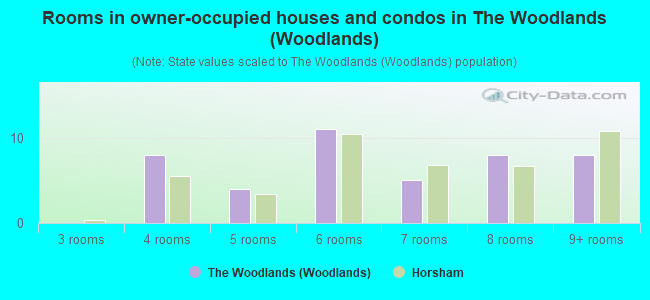
- Rooms in owner-occupied houses and condos in The Woodlands <
> - 01 room
- 02 rooms
- 03 rooms
- 84 rooms
- 45 rooms
- 116 rooms
- 57 rooms
- 88 rooms
- 89+ rooms
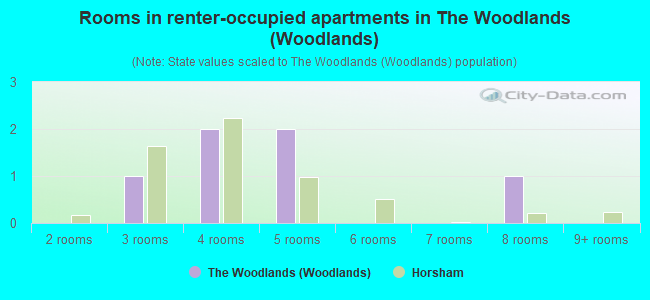
- Rooms in renter-occupied apartments in The Woodlands <
> - 01 room
- 02 rooms
- 13 rooms
- 24 rooms
- 25 rooms
- 06 rooms
- 07 rooms
- 18 rooms
- 09+ rooms
Owner-occupied
Renter-occupied
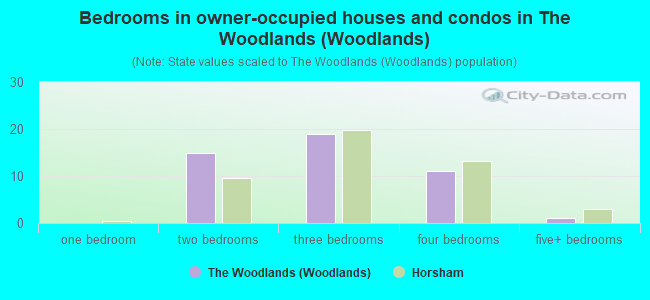
- Bedrooms in owner-occupied houses and condos in The Woodlands <
> - 0no bedroom
- 01 bedroom
- 152 bedrooms
- 193 bedrooms
- 114 bedrooms
- 15+ bedrooms
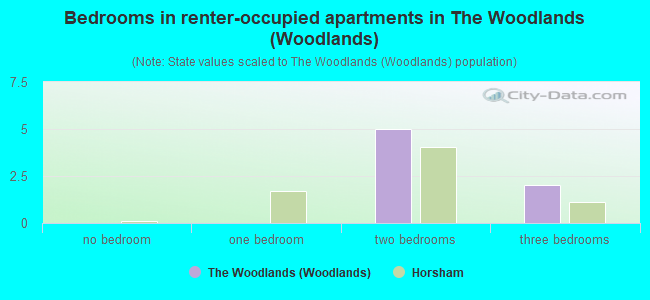
- Bedrooms in renter-occupied apartments in The Woodlands <
> - 0no bedroom
- 01 bedroom
- 52 bedrooms
- 23 bedrooms
- 04 bedrooms
- 05+ bedrooms
Average number of cars or other vehicles available in houses/condos:
Average number of cars or other vehicles available in apartments:
| This neighborhood: | 2.0 |
| Horsham: | 2.2 |
Average number of cars or other vehicles available in apartments:
| Here: | 1.7 |
| place: | 1.4 |
Percentage of units with a mortgage:
| The Woodlands (Woodlands): | 78.3% |
| Horsham: | 67.5% |
Housing prices:
- Average estimated value of detached houses in 2022 (32.1% of all units):
The Woodlands (Woodlands): $590,074 Pennsylvania: $317,202
- Average estimated value of townhouses or other attached units in 2022 (50.0% of all units):
This neighborhood: $275,074 Pennsylvania: $254,369
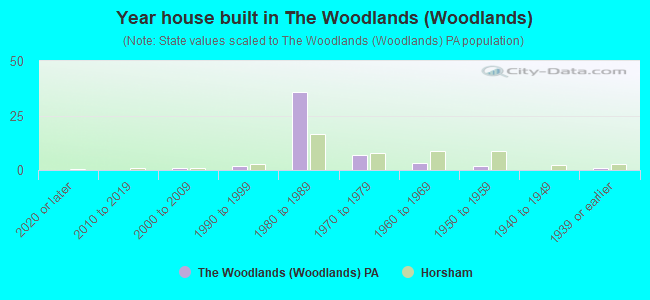
- Year house built in The Woodlands <
> - 02020 or later
- 02010 to 2019
- 12000 to 2009
- 21990 to 1999
- 361980 to 1989
- 71970 to 1979
- 31960 to 1969
- 21950 to 1959
- 01940 to 1949
- 11939 or earlier
City-data.com crime index for place in 2019 (higher means more crime):
| City: | 39.1 |
| U.S. average: | 223.9 |
Travel time to work (commute)
![Travel time to work (commute)]()
- 45 to 9 minutes
- 810 to 14 minutes
- 715 to 19 minutes
- 1120 to 24 minutes
- 425 to 29 minutes
- 330 to 34 minutes
- 235 to 39 minutes
- 340 to 44 minutes
- 745 to 59 minutes
- 360 to 89 minutes
- 190 or more minutes

Means of transportation to work
![Means of transportation to work]()
- 65.7%51Drove a car alone
- 3.9%3Carpooled
- 2.6%2Long-distance train or commuter rail
- 1.3%1Walked
- 23.2%18Worked at home

Time leaving home to go to work
![Time leaving home to go to work]()
- 112:00 a.m. to 4:59 a.m.
- 25:00 a.m. to 5:29 a.m.
- 35:30 a.m. to 5:59 a.m.
- 36:00 a.m. to 6:29 a.m.
- 36:30 a.m. to 6:59 a.m.
- 57:00 a.m. to 7:29 a.m.
- 87:30 a.m. to 7:59 a.m.
- 78:00 a.m. to 8:29 a.m.
- 38:30 a.m. to 8:59 a.m.
- 109:00 a.m. to 9:59 a.m.
- 110:00 a.m. to 10:59 a.m.
- 312:00 p.m. to 3:59 p.m.
- 24:00 p.m. to 11:59 p.m.

Occupations of males:
- Percentage of males in management occupations (except farmers):
Here: 13.4% place: 6.3%
- Percentage of males in business and financial operations occupations:
Here: 12.1% place: 9.2%
- Percentage of males in computer and mathematical occupations:
Here: 7.3% place: 6.7%
- Percentage of males in architecture and engineering occupations:
Here: 11.0% place: 7.5%
- Percentage of males in life, physical, and social science occupations:
Here: 2.8% place: 1.3%
- Percentage of males in education, training, and library occupations:
Here: 5.0% place: 1.6%
- Percentage of males in healthcare practitioners and technical occupations:
Here: 4.3% place: 1.6%
- Percentage of males in service occupations:
Here: 10.2% place: 12.9%
- Percentage of males in sales and office occupations:
Here: 14.5% place: 15.3%
- Percentage of males in construction, extraction, and maintenance occupations:
Here: 3.9% place: 13.0%
- Percentage of males in production occupations:
Here: 7.9% place: 7.1%
- Percentage of males in transportation occupations:
Here: 6.7% place: 5.1%
Occupations of females:
- Percentage of females in management occupations (except farmers):
Here: 5.7% place: 7.7%
- Percentage of females in business and financial operations occupations:
Here: 7.3% place: 5.2%
- Percentage of females in architecture and engineering occupations:
Here: 1.2% place: 1.6%
- Percentage of females in life, physical, and social science occupations:
Here: 2.4% place: 1.7%
- Percentage of females in community and social services occupations:
Here: 2.5% place: 1.5%
- Percentage of females in legal occupations:
Here: 1.7% place: 0.8%
- Percentage of females in education, training, and library occupations:
Here: 11.2% place: 10.2%
- Percentage of females in healthcare practitioners and technical occupations:
Here: 17.2% place: 15.7%
- Percentage of females in service occupations:
Here: 16.2% place: 23.5%
- Percentage of females in sales and office occupations:
Here: 29.1% place: 24.5%
- Percentage of females in production occupations:
Here: 3.2% place: 2.6%
- Percentage of females in material moving occupations:
Here: 1.5% place: 0.8%
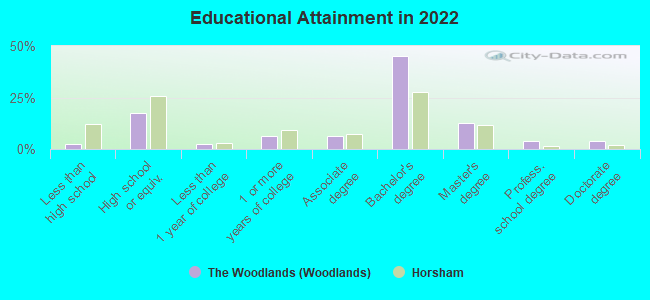
Education in this neighborhood (subdivision or community):
- Percentage of people 3 years and older in K-12 schools:
The Woodlands (Woodlands): 17.3% Horsham: 17.8%
- Percentage of people 3 years and older in undergraduate colleges:
The Woodlands (Woodlands): 0.8% Horsham: 4.2%
- Percentage of people 3 years and older in grad. or professional schools:
The Woodlands (Woodlands): 0.0% Horsham: 1.4%
- Percentage of students K-12 enrolled in private schools:
The Woodlands (Woodlands): 4.3% Horsham: 7.9%
Percentage of population below poverty level:
| The Woodlands (Woodlands): | 2.1% |
| Horsham: | 4.4% |
Median year owner moved in (as recorded in 2022):
Median year renter moved in (as recorded in 2022):
| The Woodlands (Woodlands): | 2006 |
| Horsham: | 2003 |
Median year renter moved in (as recorded in 2022):
| The Woodlands (Woodlands): | 2015 |
| Horsham: | 2015 |
Percentage of married-couple families with both working:
| The Woodlands (Woodlands): | 64.8% |
| Horsham: | 74.1% |
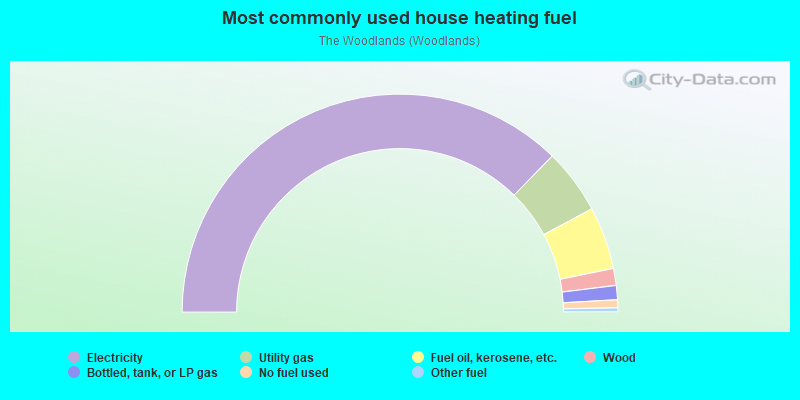
- 74.7%Electricity
- 9.7%Utility gas
- 9.3%Fuel oil, kerosene, etc.
- 2.5%Wood
- 2.1%Bottled, tank, or LP gas
- 1.2%No fuel used
- 0.6%Other fuel
Roads and streets:
Timber Rd
Length: 0.46 miles
Directions: E-W, N-S, SE-NW, SW-NE
Address range: 1 to 99
Directions: E-W, N-S, SE-NW, SW-NE
Address range: 1 to 99
Sugar Maple Ln
Length: 0.12 miles
Directions: E-W, N-S, SE-NW, SW-NE
Address range: 1 to 99
Directions: E-W, N-S, SE-NW, SW-NE
Address range: 1 to 99
Village Rd
Length: 0.12 miles
Direction: SW-NE
Address range: 1 to 99
Direction: SW-NE
Address range: 1 to 99
Mountain Ash Ln
Length: 0.09 miles
Directions: E-W, N-S, SE-NW
Address range: 1 to 99
Directions: E-W, N-S, SE-NW
Address range: 1 to 99
Sweet Gum Ln
Length: 0.08 miles
Directions: E-W, SE-NW
Address range: 1 to 99
Directions: E-W, SE-NW
Address range: 1 to 99
White Birch Ln
Length: 0.07 miles
Direction: SE-NW
Address range: 1 to 99
Direction: SE-NW
Address range: 1 to 99
Pin Oak Ln
Length: 0.05 miles
Direction: SW-NE
Address range: 1 to 99
Direction: SW-NE
Address range: 1 to 99