Technology Corridor (East Huntington Drive High-Tech Corridor) neighborhood in Monrovia, California (CA), 91010, 91016 detailed profile
Settings
X


Business Search - 14 Million verified businesses
Area: 1.079 square miles
Population: 6,293
Population density:
| Technology Corridor (East Huntington Drive High-Tech Corridor): | 5,833 people per square mile |
| Monrovia: | 2,739 people per square mile |

- 3,27046.1%Hispanic or Latino
- 1,21617.2%White
- 78511.1%Asian
- 6108.6%Black
- 4636.5%American Indian
- 3885.5%Some other race
- 2864.0%Two or more races
- 681.0%Native Hawaiian and Other
Pacific Islander

Median household income in 2022:
| Technology Corridor (East Huntington Drive High-Tech Corridor): | $98,948 |
| Monrovia: | $93,827 |
Distribution of median household income
![Distribution of median household income]()
- 82Less than $10,000
- 158$10,000 to $19,999
- 212$20,000 to $29,999
- 358$30,000 to $39,999
- 125$40,000 to $49,999
- 91$50,000 to $59,999
- 319$60,000 to $74,999
- 191$75,000 to $99,999
- 184$100,000 to $124,999
- 290$125,000 to $149,999
- 341$150,000 to $199,999
- 120$200,000 or more

Distribution of owner-occupied house/condo value
![Distribution of owner-occupied house/condo value]()
- 97Less than $50,000
- 241$50,000 to $99,999
- 48$100,000 to $149,999
- 19$200,000 to $249,999
- 23$250,000 to $299,999
- 30$300,000 to $399,999
- 117$400,000 to $499,999
- 615$500,000 to $749,999
- 289$750,000 to $999,999
- 96$1,000,000 or more

Distribution of rent paid by renters
![Distribution of rent paid by renters]()
- 35$100 to $199
- 143$200 to $299
- 50$300 to $399
- 14$400 to $499
- 19$500 to $599
- 14$600 to $699
- 240$700 to $799
- 19$800 to $899
- 93$900 to $999
- 116$1,000 to $1,249
- 180$1,250 to $1,499
- 359$1,500 to $1,999
- 963$2,000 or more

Median rent in 2022:
| Technology Corridor (East Huntington Drive High-Tech Corridor): | $1,904 |
| Monrovia: | $1,836 |
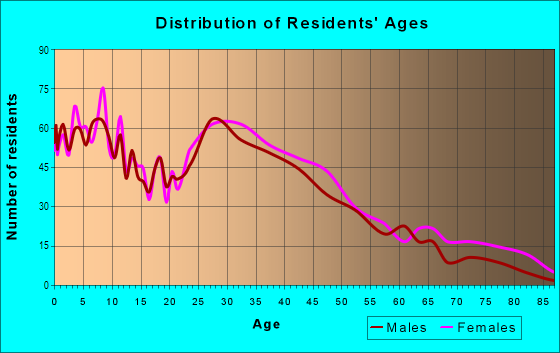
| Males: | 3,180 |
| Females: | 3,113 |
Males:
| This neighborhood: | 40.4 years |
| Whole city: | 36.5 years |
| This neighborhood: | 45.1 years |
| Whole city: | 39.9 years |
Average household size:
| Technology Corridor (East Huntington Drive High-Tech Corridor): | 3.1 people |
| Monrovia: | 2.8 people |
Percentage of family households:
| Technology Corridor (East Huntington Drive High-Tech Corridor): | 43.2% |
| Monrovia: | 50.1% |
| Here: | 35.9% |
| Monrovia: | 44.8% |
Percentage of married-couple families with children (among all households):
| Technology Corridor (East Huntington Drive High-Tech Corridor): | 21.1% |
| Monrovia: | 26.4% |
Percentage of single-mother households (among all households):
| Technology Corridor (East Huntington Drive High-Tech Corridor): | 10.9% |
| Monrovia: | 6.7% |
Percentage of never married males 15 years old and over:
Percentage of never married females 15 years old and over:
| Technology Corridor (East Huntington Drive High-Tech Corridor): | 23.1% |
| Monrovia: | 20.0% |
Percentage of never married females 15 years old and over:
| Technology Corridor (East Huntington Drive High-Tech Corridor): | 23.1% |
| city: | 17.2% |
Percentage of people that speak English not well or not at all:
| Technology Corridor (East Huntington Drive High-Tech Corridor): | 9.5% |
| Monrovia: | 4.8% |
Percentage of people born in this state:
Percentage of people born in another U.S. state:
Percentage of native residents but born outside the U.S.:
Percentage of foreign born residents:
| Here: | 61.3% |
| Monrovia: | 60.6% |
Percentage of people born in another U.S. state:
| Technology Corridor (East Huntington Drive High-Tech Corridor): | 11.7% |
| Monrovia: | 13.3% |
Percentage of native residents but born outside the U.S.:
| Here: | 0.7% |
| city: | 0.8% |
Percentage of foreign born residents:
| Here: | 26.4% |
| Monrovia: | 25.2% |

Owner-occupied
Renter-occupied


- Rooms in owner-occupied houses and condos in Technology Corridor <
> - 01 room
- 02 rooms
- 423 rooms
- 1994 rooms
- 2545 rooms
- 2736 rooms
- 717 rooms
- 868 rooms
- 2379+ rooms

- Rooms in renter-occupied apartments in Technology Corridor <
> - 431 room
- 1822 rooms
- 5033 rooms
- 3514 rooms
- 1975 rooms
- 826 rooms
- 137 rooms
- 388 rooms
- 579+ rooms
Owner-occupied
Renter-occupied

- Bedrooms in owner-occupied houses and condos in Technology Corridor <
> - 0no bedroom
- 941 bedroom
- 2952 bedrooms
- 4373 bedrooms
- 3154 bedrooms
- 185+ bedrooms

- Bedrooms in renter-occupied apartments in Technology Corridor <
> - 43no bedroom
- 6301 bedroom
- 5162 bedrooms
- 2083 bedrooms
- 384 bedrooms
- 05+ bedrooms
Average number of cars or other vehicles available in houses/condos:
Average number of cars or other vehicles available in apartments:
| This neighborhood: | 2.5 |
| Monrovia: | 2.2 |
Average number of cars or other vehicles available in apartments:
| Here: | 1.6 |
| city: | 1.8 |
Percentage of units with a mortgage:
| Technology Corridor (East Huntington Drive High-Tech Corridor): | 68.6% |
| Monrovia: | 65.1% |
Average estimated value of detached houses in 2022 (56.7% of all units):
| Technology Corridor (East Huntington Drive High-Tech Corridor): | $645,078 |
| Monrovia: | $952,225 |

- Year house built in Technology Corridor <
> - 772020 or later
- 1612010 to 2019
- 1892000 to 2009
- 1361990 to 1999
- 2761980 to 1989
- 2751970 to 1979
- 3641960 to 1969
- 3781950 to 1959
- 3291940 to 1949
- 991939 or earlier

City-data.com crime index for city in 2020 (higher means more crime):
| City: | 183.5 |
| U.S. average: | 219.5 |
Travel time to work (commute)
![Travel time to work (commute)]()
- 62Less than 5 minutes
- 1825 to 9 minutes
- 16110 to 14 minutes
- 19315 to 19 minutes
- 44320 to 24 minutes
- 13325 to 29 minutes
- 78830 to 34 minutes
- 2835 to 39 minutes
- 20340 to 44 minutes
- 12545 to 59 minutes
- 15960 to 89 minutes
- 9790 or more minutes

Means of transportation to work
![Means of transportation to work]()
- 75.0%2,546Drove a car alone
- 5.7%195Carpooled
- 1.1%36Bus
- 2.8%95Subway or elevated rail
- 0.3%9Long-distance train or commuter rail
- 0.5%18Light rail, streetcar or trolley
- 2.7%93Bicycle
- 3.7%125Walked
- 2.9%99Other means
- 13.3%451Worked at home

Time leaving home to go to work
![Time leaving home to go to work]()
- 27712:00 a.m. to 4:59 a.m.
- 1145:00 a.m. to 5:29 a.m.
- 1525:30 a.m. to 5:59 a.m.
- 1656:00 a.m. to 6:29 a.m.
- 1206:30 a.m. to 6:59 a.m.
- 4797:00 a.m. to 7:29 a.m.
- 3887:30 a.m. to 7:59 a.m.
- 2718:00 a.m. to 8:29 a.m.
- 1278:30 a.m. to 8:59 a.m.
- 1529:00 a.m. to 9:59 a.m.
- 13710:00 a.m. to 10:59 a.m.
- 5711:00 a.m. to 11:59 a.m.
- 11612:00 p.m. to 3:59 p.m.
- 964:00 p.m. to 11:59 p.m.

Occupations of males:
- Percentage of males in management occupations (except farmers):
Here: 17.6% city: 12.7%
- Percentage of males in business and financial operations occupations:
Here: 1.3% city: 3.1%
- Percentage of males in computer and mathematical occupations:
Here: 4.9% city: 4.5%
- Percentage of males in architecture and engineering occupations:
Here: 3.1% city: 4.8%
- Percentage of males in life, physical, and social science occupations:
Here: 3.7% city: 1.4%
- Percentage of males in education, training, and library occupations:
Here: 4.5% city: 5.1%
- Percentage of males in arts, design, entertainment, sports, and media occupations:
Here: 5.1% city: 4.2%
- Percentage of males in service occupations:
Here: 20.3% city: 13.0%
- Percentage of males in sales and office occupations:
Here: 8.2% city: 19.9%
- Percentage of males in construction, extraction, and maintenance occupations:
Here: 16.2% city: 10.7%
- Percentage of males in production occupations:
Here: 4.7% city: 4.8%
- Percentage of males in transportation occupations:
Here: 6.2% city: 4.1%
- Percentage of males in material moving occupations:
Here: 2.6% city: 2.7%
Occupations of females:
- Percentage of females in management occupations (except farmers):
Here: 13.4% city: 13.3%
- Percentage of females in computer and mathematical occupations:
Here: 1.7% city: 2.4%
- Percentage of females in community and social services occupations:
Here: 7.6% city: 4.3%
- Percentage of females in education, training, and library occupations:
Here: 18.2% city: 11.6%
- Percentage of females in arts, design, entertainment, sports, and media occupations:
Here: 4.5% city: 4.0%
- Percentage of females in healthcare practitioners and technical occupations:
Here: 4.0% city: 9.7%
- Percentage of females in service occupations:
Here: 20.7% city: 16.1%
- Percentage of females in sales and office occupations:
Here: 23.0% city: 26.0%
- Percentage of females in production occupations:
Here: 5.1% city: 2.5%
Percentage of people 16-64 in Armed Forces:
| Technology Corridor (East Huntington Drive High-Tech Corridor): | 0.3% |
| Monrovia: | 0.1% |
Education in this neighborhood (subdivision or community):
- Percentage of people 3 years and older in K-12 schools:
Technology Corridor (East Huntington Drive High-Tech Corridor): 25.0% Monrovia: 16.9%
- Percentage of people 3 years and older in undergraduate colleges:
Technology Corridor (East Huntington Drive High-Tech Corridor): 7.4% Monrovia: 5.6%
- Percentage of people 3 years and older in grad. or professional schools:
Technology Corridor (East Huntington Drive High-Tech Corridor): 4.0% Monrovia: 2.0%
- Percentage of students K-12 enrolled in private schools:
Technology Corridor (East Huntington Drive High-Tech Corridor): 17.0% Monrovia: 10.9%
Percentage of population below poverty level:
| Technology Corridor (East Huntington Drive High-Tech Corridor): | 9.2% |
| Monrovia: | 10.1% |
Median year owner moved in (as recorded in 2022):
Median year renter moved in (as recorded in 2022):
| Technology Corridor (East Huntington Drive High-Tech Corridor): | 2183 |
| Monrovia: | 2004 |
Median year renter moved in (as recorded in 2022):
| Technology Corridor (East Huntington Drive High-Tech Corridor): | 2194 |
| Monrovia: | 2015 |
Percentage of married-couple families with both working:
| Technology Corridor (East Huntington Drive High-Tech Corridor): | 103.6% |
| Monrovia: | 64.0% |

- 52.0%Utility gas
- 27.7%Electricity
- 7.4%Fuel oil, kerosene, etc.
- 4.6%No fuel used
- 3.8%Solar energy
- 3.3%Bottled, tank, or LP gas
- 1.1%Other fuel
Limited-access highways (interstate or state) in this neighborhood:
Foothill Fwy (I- 210)
Length: 4.16 miles
Directions: E-W, SE-NW
Directions: E-W, SE-NW
Roads and streets:
E Huntington Dr
Length: 2.52 miles
Directions: E-W, SE-NW
Address range: 100 to 1035
Directions: E-W, SE-NW
Address range: 100 to 1035
W Huntington Dr
Length: 1.82 miles
Direction: E-W
Address range: 100 to 917
Direction: E-W
Address range: 100 to 917
E Evergreen Ave
Length: 1.00 miles
Direction: E-W
Direction: E-W
E Central Ave
Length: 1.00 miles
Direction: E-W
Address range: 101 to 899
Direction: E-W
Address range: 101 to 899
W Maple Ave
Length: 0.92 miles
Direction: E-W
Address range: 100 to 699
Direction: E-W
Address range: 100 to 699
E Cypress Ave
Length: 0.88 miles
Directions: E-W, N-S, SW-NE
Address range: 100 to 799
Directions: E-W, N-S, SW-NE
Address range: 100 to 799
E Los Angeles Ave (Los Angeles Ave)
Length: 0.80 miles
Direction: E-W
Address range: 100 to 799
Direction: E-W
Address range: 100 to 799
Montana St
Length: 0.72 miles
Directions: E-W, SE-NW, SW-NE
Address range: 100 to 799
Directions: E-W, SE-NW, SW-NE
Address range: 100 to 799
E Cherry Ave
Length: 0.61 miles
Direction: E-W
Address range: 100 to 599
Direction: E-W
Address range: 100 to 599
W Evergreen Ave
Length: 0.61 miles
Directions: E-W, SE-NW
Address range: 100 to 499
Directions: E-W, SE-NW
Address range: 100 to 499
W Central Ave
Length: 0.61 miles
Direction: E-W
Address range: 300 to 499
Direction: E-W
Address range: 300 to 499
E Maple Ave
Length: 0.60 miles
Direction: E-W
Address range: 100 to 699
Direction: E-W
Address range: 100 to 699
S Myrtle Ave
Length: 0.50 miles
Direction: N-S
Address range: 1000 to 1599
Direction: N-S
Address range: 1000 to 1599
S Ivy Ave
Length: 0.50 miles
Directions: N-S, SE-NW
Address range: 1000 to 1599
Directions: N-S, SE-NW
Address range: 1000 to 1599
S Magnolia Ave
Length: 0.50 miles
Direction: N-S
Address range: 1000 to 1616
Direction: N-S
Address range: 1000 to 1616
S California Ave
Length: 0.49 miles
Direction: N-S
Address range: 1000 to 1599
Direction: N-S
Address range: 1000 to 1599
Shamrock Ave
Length: 0.47 miles
Direction: N-S
Address range: 1000 to 1537
Direction: N-S
Address range: 1000 to 1537
Alta St
Length: 0.46 miles
Direction: E-W
Address range: 500 to 999
Direction: E-W
Address range: 500 to 999
S Mayflower Ave
Length: 0.46 miles
Direction: N-S
Address range: 1000 to 1599
Direction: N-S
Address range: 1000 to 1599
W Cypress Ave
Length: 0.45 miles
Direction: E-W
Address range: 100 to 399
Direction: E-W
Address range: 100 to 399
Bonita St
Length: 0.45 miles
Directions: E-W, SE-NW
Address range: 500 to 899
Directions: E-W, SE-NW
Address range: 500 to 899
S Primrose Ave
Length: 0.44 miles
Directions: N-S, SE-NW
Address range: 1000 to 1599
Directions: N-S, SE-NW
Address range: 1000 to 1599
E Pomona Ave
Length: 0.40 miles
Direction: E-W
Address range: 100 to 399
Direction: E-W
Address range: 100 to 399
E Fig Ave
Length: 0.36 miles
Direction: E-W
Address range: 100 to 399
Direction: E-W
Address range: 100 to 399
Monterey Ave
Length: 0.34 miles
Direction: N-S
Address range: 927 to 1499
Direction: N-S
Address range: 927 to 1499
Mountain Ave
Length: 0.32 miles
Direction: N-S
Address range: 1190 to 1599
Direction: N-S
Address range: 1190 to 1599
S Alta Vista Ave
Length: 0.31 miles
Directions: N-S, SW-NE
Address range: 1000 to 1499
Directions: N-S, SW-NE
Address range: 1000 to 1499
W Cherry Ave
Length: 0.30 miles
Direction: E-W
Address range: 100 to 299
Direction: E-W
Address range: 100 to 299
W Pomona Ave
Length: 0.30 miles
Direction: E-W
Address range: 100 to 299
Direction: E-W
Address range: 100 to 299
Alamitas Ave
Length: 0.29 miles
Direction: N-S
Address range: 1100 to 1599
Direction: N-S
Address range: 1100 to 1599
Sherman Ave
Length: 0.26 miles
Direction: N-S
Address range: 1100 to 1399
Direction: N-S
Address range: 1100 to 1399
Anita St
Length: 0.24 miles
Directions: E-W, N-S, SE-NW
Address range: 600 to 799
Directions: E-W, N-S, SE-NW
Address range: 600 to 799
Diamond St
Length: 0.24 miles
Direction: E-W
Address range: 502 to 699
Direction: E-W
Address range: 502 to 699
Loma Ave
Length: 0.24 miles
Direction: N-S
Address range: 1100 to 1499
Direction: N-S
Address range: 1100 to 1499
Encino Ave
Length: 0.15 miles
Direction: N-S
Address range: 1100 to 1299
Direction: N-S
Address range: 1100 to 1299
Fig Ave
Length: 0.14 miles
Direction: E-W
Address range: 500 to 699
Direction: E-W
Address range: 500 to 699
Central Ave
Length: 0.12 miles
Direction: E-W
Address range: 900 to 999
Direction: E-W
Address range: 900 to 999
Bloomdale St
Length: 0.12 miles
Direction: E-W
Address range: 900 to 949
Direction: E-W
Address range: 900 to 949
Los Robles Ave
Length: 0.11 miles
Direction: N-S
Address range: 1200 to 1499
Direction: N-S
Address range: 1200 to 1499
Fig Ln
Length: 0.11 miles
Directions: E-W, SE-NW
Address range: 400 to 499
Directions: E-W, SE-NW
Address range: 400 to 499
Parkrose Ave
Length: 0.10 miles
Direction: N-S
Address range: 1300 to 1438
Direction: N-S
Address range: 1300 to 1438
S Canyon Blvd
Length: 0.07 miles
Direction: N-S
Address range: 1000 to 1099
Direction: N-S
Address range: 1000 to 1099
Highway Esplanade
Length: 0.06 miles
Direction: N-S
Address range: 1000 to 1099
Direction: N-S
Address range: 1000 to 1099
Pilgrim Way
Length: 0.04 miles
Direction: SE-NW
Address range: 1400 to 1437
Direction: SE-NW
Address range: 1400 to 1437
Dale Dr
Length: 0.04 miles
Direction: N-S
Address range: 1500 to 1599
Direction: N-S
Address range: 1500 to 1599
Maynard Dr
Length: 0.03 miles
Directions: E-W, SW-NE
Address range: 900 to 1153
Directions: E-W, SW-NE
Address range: 900 to 1153
Railroad features:
at and Sf Rlwy
Length: 0.59 miles
Direction: E-W
Direction: E-W
Other features:
Sawpit Wash
Length: 0.34 miles
Direction: N-S
Direction: N-S