Tanforan neighborhood in San Bruno, California (CA), 94066 detailed profile
Settings
X


Business Search - 14 Million verified businesses
Area: 0.423 square miles
Population: 522
Population density:
| Tanforan: | 1,233 people per square mile |
| San Bruno: | 7,913 people per square mile |

- 29342.4%Asian
- 16223.4%Some other race
- 12417.9%Hispanic or Latino
- 547.8%White
- 415.9%Two or more races
- 91.3%American Indian
- 81.2%Native Hawaiian and Other
Pacific Islander

Median household income in 2022:
| Tanforan: | $135,423 |
| San Bruno: | $131,669 |
Distribution of median household income
![Distribution of median household income]()
- 1Less than $10,000
- 13$10,000 to $19,999
- 21$20,000 to $29,999
- 6$30,000 to $39,999
- 43$40,000 to $49,999
- 5$50,000 to $59,999
- 3$60,000 to $74,999
- 39$75,000 to $99,999
- 17$100,000 to $124,999
- 11$125,000 to $149,999
- 46$150,000 to $199,999
- 75$200,000 or more

Distribution of owner-occupied house/condo value
![Distribution of owner-occupied house/condo value]()
- 25Less than $50,000
- 125$50,000 to $99,999
- 24$100,000 to $149,999
- 5$150,000 to $199,999
- 1$300,000 to $399,999
- 6$400,000 to $499,999
- 18$500,000 to $749,999
- 12$750,000 to $999,999
- 155$1,000,000 or more

Distribution of rent paid by renters
![Distribution of rent paid by renters]()
- 25$100 to $199
- 1$200 to $299
- 1$300 to $399
- 20$400 to $499
- 5$500 to $599
- 1$600 to $699
- 6$700 to $799
- 10$800 to $899
- 14$900 to $999
- 1$1,000 to $1,249
- 3$1,250 to $1,499
- 11$1,500 to $1,999
- 177$2,000 or more

Median rent in 2022:
| Tanforan: | $3,500 |
| San Bruno: | $2,001 |
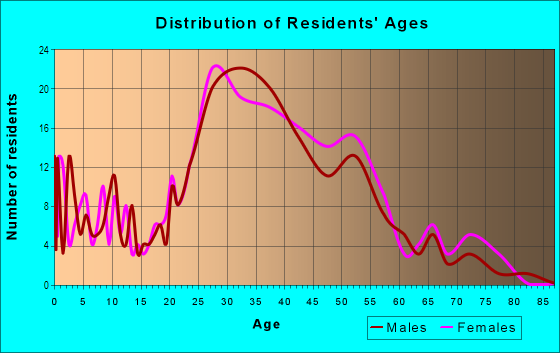
| Males: | 236 |
| Females: | 286 |
Males:
| This neighborhood: | 38.6 years |
| Whole city: | 36.8 years |
| This neighborhood: | 43.0 years |
| Whole city: | 41.6 years |
Average household size:
| Tanforan: | 2.9 people |
| San Bruno: | 2.8 people |
Percentage of family households:
| Tanforan: | 40.4% |
| San Bruno: | 45.6% |
| Here: | 44.3% |
| San Bruno: | 52.4% |
Percentage of married-couple families with children (among all households):
| Tanforan: | 40.2% |
| San Bruno: | 27.4% |
Percentage of single-mother households (among all households):
| Tanforan: | 2.0% |
| San Bruno: | 5.2% |
Percentage of never married males 15 years old and over:
Percentage of never married females 15 years old and over:
| Tanforan: | 23.2% |
| San Bruno: | 20.4% |
Percentage of never married females 15 years old and over:
| Tanforan: | 22.8% |
| city: | 15.1% |
Percentage of people that speak English not well or not at all:
| Tanforan: | 13.7% |
| San Bruno: | 7.3% |
Percentage of people born in this state:
Percentage of people born in another U.S. state:
Percentage of native residents but born outside the U.S.:
Percentage of foreign born residents:
| Here: | 42.5% |
| San Bruno: | 53.6% |
Percentage of people born in another U.S. state:
| Tanforan: | 10.7% |
| San Bruno: | 7.8% |
Percentage of native residents but born outside the U.S.:
| Here: | 1.9% |
| city: | 1.5% |
Percentage of foreign born residents:
| Here: | 45.0% |
| San Bruno: | 37.2% |

Owner-occupied
Renter-occupied


- Rooms in owner-occupied houses and condos in Tanforan
- 41 room
- 292 rooms
- 173 rooms
- 74 rooms
- 85 rooms
- 106 rooms
- 57 rooms
- 1068 rooms
- 29+ rooms

- Rooms in renter-occupied apartments in Tanforan
- 131 room
- 242 rooms
- 743 rooms
- 324 rooms
- 345 rooms
- 36 rooms
- 737 rooms
- 128 rooms
- 119+ rooms
Owner-occupied
Renter-occupied

- Bedrooms in owner-occupied houses and condos in Tanforan
- 4no bedroom
- 181 bedroom
- 122 bedrooms
- 183 bedrooms
- 44 bedrooms
- 05+ bedrooms

- Bedrooms in renter-occupied apartments in Tanforan
- 13no bedroom
- 831 bedroom
- 552 bedrooms
- 303 bedrooms
- 124 bedrooms
- 55+ bedrooms
Average number of cars or other vehicles available in houses/condos:
Average number of cars or other vehicles available in apartments:
| This neighborhood: | 1.7 |
| San Bruno: | 2.2 |
Average number of cars or other vehicles available in apartments:
| Here: | 1.6 |
| city: | 1.6 |
Percentage of units with a mortgage:
| Tanforan: | 72.5% |
| San Bruno: | 69.6% |
Average estimated '22 value of housing units in 5-or-more-unit structures (77.8% of all units):
| Tanforan: | $135,846 |
| California: | $730,996 |

- Year house built in Tanforan
- 02020 or later
- 782010 to 2019
- 572000 to 2009
- 291990 to 1999
- 191980 to 1989
- 121970 to 1979
- 151960 to 1969
- 41950 to 1959
- 121940 to 1949
- 31939 or earlier

City-data.com crime index for city in 2020 (higher means more crime):
| City: | 177.8 |
| U.S. average: | 219.5 |
Travel time to work (commute)
![Travel time to work (commute)]()
- 19Less than 5 minutes
- 825 to 9 minutes
- 10810 to 14 minutes
- 16315 to 19 minutes
- 7720 to 24 minutes
- 3125 to 29 minutes
- 12430 to 34 minutes
- 1135 to 39 minutes
- 8140 to 44 minutes
- 3545 to 59 minutes
- 4960 to 89 minutes
- 1190 or more minutes

Means of transportation to work
![Means of transportation to work]()
- 58.4%211Drove a car alone
- 8.0%29Carpooled
- 5.3%19Bus
- 6.1%22Subway or elevated rail
- 4.7%17Long-distance train or commuter rail
- 2.2%8Light rail, streetcar or trolley
- 1.4%5Taxi
- 9.4%34Motorcycle
- 0.3%1Bicycle
- 4.7%17Walked
- 2.8%10Other means
- 10.2%37Worked at home

Time leaving home to go to work
![Time leaving home to go to work]()
- 6112:00 a.m. to 4:59 a.m.
- 185:00 a.m. to 5:29 a.m.
- 205:30 a.m. to 5:59 a.m.
- 276:00 a.m. to 6:29 a.m.
- 516:30 a.m. to 6:59 a.m.
- 667:00 a.m. to 7:29 a.m.
- 637:30 a.m. to 7:59 a.m.
- 1138:00 a.m. to 8:29 a.m.
- 838:30 a.m. to 8:59 a.m.
- 1619:00 a.m. to 9:59 a.m.
- 3610:00 a.m. to 10:59 a.m.
- 1911:00 a.m. to 11:59 a.m.
- 5612:00 p.m. to 3:59 p.m.
- 644:00 p.m. to 11:59 p.m.

Occupations of males:
- Percentage of males in management occupations (except farmers):
Here: 27.7% city: 12.7%
- Percentage of males in computer and mathematical occupations:
Here: 29.2% city: 9.0%
- Percentage of males in architecture and engineering occupations:
Here: 8.3% city: 4.1%
- Percentage of males in life, physical, and social science occupations:
Here: 2.3% city: 2.6%
- Percentage of males in education, training, and library occupations:
Here: 2.8% city: 2.3%
- Percentage of males in service occupations:
Here: 11.1% city: 17.6%
- Percentage of males in sales and office occupations:
Here: 8.9% city: 13.7%
- Percentage of males in construction, extraction, and maintenance occupations:
Here: 4.7% city: 9.3%
- Percentage of males in production occupations:
Here: 7.8% city: 5.4%
Occupations of females:
- Percentage of females in management occupations (except farmers):
Here: 19.6% city: 11.1%
- Percentage of females in business and financial operations occupations:
Here: 8.3% city: 10.4%
- Percentage of females in computer and mathematical occupations:
Here: 12.9% city: 3.0%
- Percentage of females in life, physical, and social science occupations:
Here: 10.5% city: 3.2%
- Percentage of females in education, training, and library occupations:
Here: 8.6% city: 5.5%
- Percentage of females in arts, design, entertainment, sports, and media occupations:
Here: 1.9% city: 1.1%
- Percentage of females in healthcare practitioners and technical occupations:
Here: 4.6% city: 9.0%
- Percentage of females in service occupations:
Here: 10.8% city: 20.3%
- Percentage of females in sales and office occupations:
Here: 13.8% city: 26.0%
- Percentage of females in transportation occupations:
Here: 6.7% city: 2.2%
- Percentage of females in material moving occupations:
Here: 2.4% city: 3.0%
Percentage of people 16-64 in Armed Forces:
| Tanforan: | 0.4% |
| San Bruno: | 0.2% |
Education in this neighborhood (subdivision or community):
- Percentage of people 3 years and older in K-12 schools:
Tanforan: 14.1% San Bruno: 13.8%
- Percentage of people 3 years and older in undergraduate colleges:
Tanforan: 4.8% San Bruno: 6.2%
- Percentage of people 3 years and older in grad. or professional schools:
Tanforan: 4.3% San Bruno: 1.4%
- Percentage of students K-12 enrolled in private schools:
Tanforan: 190.4% San Bruno: 22.1%
Percentage of population below poverty level:
| Tanforan: | 8.4% |
| San Bruno: | 5.6% |
Median year owner moved in (as recorded in 2022):
Median year renter moved in (as recorded in 2022):
| Tanforan: | 2004 |
| San Bruno: | 2003 |
Median year renter moved in (as recorded in 2022):
| Tanforan: | 2012 |
| San Bruno: | 2015 |
Percentage of married-couple families with both working:
| Tanforan: | 104.0% |
| San Bruno: | 80.8% |

- 55.8%Utility gas
- 31.6%Electricity
- 4.9%No fuel used
- 3.4%Bottled, tank, or LP gas
- 2.1%Solar energy
- 1.3%Wood
- 1.0%Fuel oil, kerosene, etc.
Limited-access highways (interstate or state) in this neighborhood:
I- 380
Length: 1.43 miles
Directions: E-W, SE-NW, SW-NE
Directions: E-W, SE-NW, SW-NE
Highways in this neighborhood:
el Camino Real (State Hwy 82)
Length: 0.61 miles
Direction: SE-NW
Direction: SE-NW
Roads and streets:
Sneath Ln
Length: 1.30 miles
Directions: E-W, SW-NE
Address range: 200 to 1951
Directions: E-W, SW-NE
Address range: 200 to 1951
Huntington Ave
Length: 0.70 miles
Directions: E-W, SE-NW
Address range: 1000 to 1399
Directions: E-W, SE-NW
Address range: 1000 to 1399
Commodore Dr
Length: 0.68 miles
Directions: E-W, SE-NW
Address range: 271 to 1399
Directions: E-W, SE-NW
Address range: 271 to 1399
Piccadilly Pl
Length: 0.47 miles
Directions: E-W, N-S, SE-NW, SW-NE
Address range: 100 to 423
Directions: E-W, N-S, SE-NW, SW-NE
Address range: 100 to 423
Boardwalk Dr
Length: 0.29 miles
Direction: E-W
Address range: 1 to 499
Direction: E-W
Address range: 1 to 499
Cherry Ave
Length: 0.28 miles
Direction: SE-NW
Address range: 1020 to 1199
Direction: SE-NW
Address range: 1020 to 1199
Sea Biscuit Ave
Length: 0.27 miles
Direction: SE-NW
Address range: 1200 to 1399
Direction: SE-NW
Address range: 1200 to 1399
Noor Ave
Length: 0.26 miles
Direction: E-W
Address range: 400 to 498
Direction: E-W
Address range: 400 to 498
Citation Ave
Length: 0.25 miles
Directions: E-W, SW-NE
Address range: 100 to 699
Directions: E-W, SW-NE
Address range: 100 to 699
National Ave
Length: 0.25 miles
Direction: SE-NW
Direction: SE-NW
Huntington Ave E
Length: 0.21 miles
Directions: N-S, SE-NW, SW-NE
Address range: 1067 to 1299
Directions: N-S, SE-NW, SW-NE
Address range: 1067 to 1299
Commodore Dr W
Length: 0.15 miles
Direction: E-W
Direction: E-W
Admiral Ct
Length: 0.12 miles
Direction: SE-NW
Direction: SE-NW
Boardwalk Pl
Length: 0.11 miles
Directions: N-S, SE-NW
Address range: 100 to 199
Directions: N-S, SE-NW
Address range: 100 to 199
Boardwalk Ct
Length: 0.10 miles
Directions: E-W, SE-NW
Directions: E-W, SE-NW
Forest Ln
Length: 0.09 miles
Direction: E-W
Address range: 19 to 99
Direction: E-W
Address range: 19 to 99
I- 280
Length: 0.06 miles
Direction: SE-NW
Direction: SE-NW
Railroad features:
Bay Area Rapid Transit RR
Length: 0.66 miles
Direction: SE-NW
Direction: SE-NW
Other features:
San Bruno Crk
Length: 0.45 miles
Directions: E-W, SE-NW, SW-NE
Directions: E-W, SE-NW, SW-NE