Sundown Terrace neighborhood in Orinda, California (CA), 94549, 94563 detailed profile
Settings
X


Business Search - 14 Million verified businesses
Area: 0.546 square miles
Population: 505
Population density:
| Sundown Terrace: | 926 people per square mile |
| Orinda: | 1,547 people per square mile |

- 42280.7%White
- 326.1%Two or more races
- 254.8%Asian
- 244.6%Hispanic or Latino
- 203.8%Some other race

Median household income in 2022:
| Sundown Terrace: | $250,001 |
| Orinda: | $250,001 |
Distribution of median household income
![Distribution of median household income]()
- 19Less than $10,000
- 13$10,000 to $19,999
- 16$20,000 to $29,999
- 7$30,000 to $39,999
- 8$40,000 to $49,999
- 5$50,000 to $59,999
- 4$60,000 to $74,999
- 9$75,000 to $99,999
- 4$100,000 to $124,999
- 9$125,000 to $149,999
- 25$150,000 to $199,999
- 153$200,000 or more

Distribution of owner-occupied house/condo value
![Distribution of owner-occupied house/condo value]()
- 4Less than $50,000
- 3$100,000 to $149,999
- 7$500,000 to $749,999
- 9$750,000 to $999,999
- 175$1,000,000 or more

Distribution of rent paid by renters
![Distribution of rent paid by renters]()
- 2$200 to $299
- 10$300 to $399
- 3$400 to $499
- 1$500 to $599
- 3$800 to $899
- 17$2,000 or more

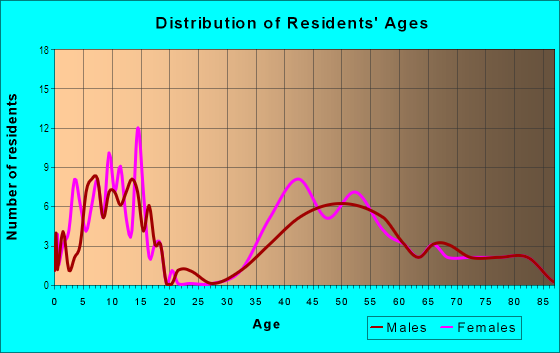
| Males: | 242 |
| Females: | 263 |
Males:
| This neighborhood: | 49.5 years |
| Whole city: | 50.3 years |
| This neighborhood: | 47.0 years |
| Whole city: | 48.0 years |
Average household size:
| Sundown Terrace: | 2.8 people |
| Orinda: | 2.6 people |
Percentage of family households:
| Sundown Terrace: | 49.5% |
| Orinda: | 48.6% |
| Here: | 78.5% |
| Orinda: | 67.8% |
Percentage of married-couple families with children (among all households):
| Sundown Terrace: | 37.0% |
| Orinda: | 36.7% |
Percentage of single-mother households (among all households):
| Sundown Terrace: | 0.5% |
| Orinda: | 0.7% |
Percentage of never married males 15 years old and over:
Percentage of never married females 15 years old and over:
| Sundown Terrace: | 6.6% |
| Orinda: | 11.4% |
Percentage of never married females 15 years old and over:
| Sundown Terrace: | 10.5% |
| city: | 10.3% |
Percentage of people that speak English not well or not at all:
| Sundown Terrace: | 0.0% |
| Orinda: | 0.9% |
Percentage of people born in this state:
Percentage of people born in another U.S. state:
Percentage of native residents but born outside the U.S.:
Percentage of foreign born residents:
| Here: | 46.3% |
| Orinda: | 51.1% |
Percentage of people born in another U.S. state:
| Sundown Terrace: | 36.5% |
| Orinda: | 29.1% |
Percentage of native residents but born outside the U.S.:
| Here: | 0.5% |
| city: | 1.5% |
Percentage of foreign born residents:
| Here: | 16.7% |
| Orinda: | 18.3% |

Owner-occupied
Renter-occupied


- Rooms in owner-occupied houses and condos in Sundown Terrace
- 01 room
- 02 rooms
- 43 rooms
- 64 rooms
- 105 rooms
- 166 rooms
- 377 rooms
- 458 rooms
- 819+ rooms

- Rooms in renter-occupied apartments in Sundown Terrace
- 21 room
- 42 rooms
- 113 rooms
- 54 rooms
- 25 rooms
- 106 rooms
- 27 rooms
- 48 rooms
- 69+ rooms
Owner-occupied
Renter-occupied

- Bedrooms in owner-occupied houses and condos in Sundown Terrace
- 0no bedroom
- 01 bedroom
- 82 bedrooms
- 323 bedrooms
- 1004 bedrooms
- 445+ bedrooms

- Bedrooms in renter-occupied apartments in Sundown Terrace
- 2no bedroom
- 151 bedroom
- 52 bedrooms
- 83 bedrooms
- 44 bedrooms
- 35+ bedrooms
Average number of cars or other vehicles available in houses/condos:
Average number of cars or other vehicles available in apartments:
| This neighborhood: | 2.6 |
| Orinda: | 2.3 |
Average number of cars or other vehicles available in apartments:
| Here: | |
| city: |
Percentage of units with a mortgage:
| Sundown Terrace: | 72.3% |
| Orinda: | 70.5% |
Average estimated value of detached houses in 2022 (99.0% of all units):
| Sundown Terrace: | $2,368,808 |
| California: | $988,808 |

- Year house built in Sundown Terrace
- 02020 or later
- 152010 to 2019
- 72000 to 2009
- 41990 to 1999
- 111980 to 1989
- 241970 to 1979
- 351960 to 1969
- 711950 to 1959
- 301940 to 1949
- 291939 or earlier

City-data.com crime index for city in 2020 (higher means more crime):
| City: | 42.7 |
| U.S. average: | 219.5 |
Travel time to work (commute)
![Travel time to work (commute)]()
- 95 to 9 minutes
- 1110 to 14 minutes
- 1215 to 19 minutes
- 1920 to 24 minutes
- 625 to 29 minutes
- 830 to 34 minutes
- 440 to 44 minutes
- 3145 to 59 minutes
- 2860 to 89 minutes
- 290 or more minutes

Means of transportation to work
![Means of transportation to work]()
- 42.0%83Drove a car alone
- 6.1%12Carpooled
- 0.5%1Bus
- 15.2%30Subway or elevated rail
- 5.6%11Long-distance train or commuter rail
- 0.5%1Light rail, streetcar or trolley
- 2.0%4Bicycle
- 6.1%12Walked
- 4.6%9Other means
- 29.9%59Worked at home

Time leaving home to go to work
![Time leaving home to go to work]()
- 412:00 a.m. to 4:59 a.m.
- 85:00 a.m. to 5:29 a.m.
- 35:30 a.m. to 5:59 a.m.
- 146:00 a.m. to 6:29 a.m.
- 96:30 a.m. to 6:59 a.m.
- 157:00 a.m. to 7:29 a.m.
- 157:30 a.m. to 7:59 a.m.
- 188:00 a.m. to 8:29 a.m.
- 148:30 a.m. to 8:59 a.m.
- 199:00 a.m. to 9:59 a.m.
- 910:00 a.m. to 10:59 a.m.
- 612:00 p.m. to 3:59 p.m.
- 84:00 p.m. to 11:59 p.m.

Occupations of males:
- Percentage of males in management occupations (except farmers):
Here: 52.7% city: 34.1%
- Percentage of males in business and financial operations occupations:
Here: 20.1% city: 10.7%
- Percentage of males in computer and mathematical occupations:
Here: 7.5% city: 4.2%
- Percentage of males in legal occupations:
Here: 7.9% city: 6.7%
- Percentage of males in sales and office occupations:
Here: 8.6% city: 11.4%
Occupations of females:
- Percentage of females in management occupations (except farmers):
Here: 15.4% city: 15.1%
- Percentage of females in business and financial operations occupations:
Here: 11.6% city: 10.2%
- Percentage of females in computer and mathematical occupations:
Here: 8.9% city: 5.9%
- Percentage of females in legal occupations:
Here: 11.8% city: 7.8%
- Percentage of females in education, training, and library occupations:
Here: 8.4% city: 13.6%
- Percentage of females in arts, design, entertainment, sports, and media occupations:
Here: 5.8% city: 8.8%
- Percentage of females in healthcare practitioners and technical occupations:
Here: 16.4% city: 11.5%
- Percentage of females in service occupations:
Here: 8.1% city: 7.1%
- Percentage of females in sales and office occupations:
Here: 12.5% city: 8.1%
Education in this neighborhood (subdivision or community):
- Percentage of people 3 years and older in K-12 schools:
Sundown Terrace: 29.4% Orinda: 20.8%
- Percentage of people 3 years and older in undergraduate colleges:
Sundown Terrace: 1.8% Orinda: 3.5%
- Percentage of people 3 years and older in grad. or professional schools:
Sundown Terrace: 1.4% Orinda: 1.3%
- Percentage of students K-12 enrolled in private schools:
Sundown Terrace: 18.5% Orinda: 7.3%
Percentage of population below poverty level:
| Sundown Terrace: | 3.5% |
| Orinda: | 2.1% |
Median year owner moved in (as recorded in 2022):
| Sundown Terrace: | 2006 |
| Orinda: | 2005 |
Percentage of married-couple families with both working:
| Sundown Terrace: | 54.1% |
| Orinda: | 71.9% |

- 81.8%Utility gas
- 8.2%Electricity
- 5.8%No fuel used
- 3.3%Solar energy
- 1.0%Bottled, tank, or LP gas
Roads and streets:
Lombardy Ln
Length: 1.13 miles
Directions: E-W, N-S, SE-NW, SW-NE
Address range: 1 to 199
Directions: E-W, N-S, SE-NW, SW-NE
Address range: 1 to 199
Dalewood Dr
Length: 0.79 miles
Directions: E-W, N-S, SE-NW, SW-NE
Address range: 64 to 546
Directions: E-W, N-S, SE-NW, SW-NE
Address range: 64 to 546
Van Ripper Ln
Length: 0.71 miles
Directions: E-W, N-S, SE-NW, SW-NE
Address range: 22 to 199
Directions: E-W, N-S, SE-NW, SW-NE
Address range: 22 to 199
Sundown Terace (Sundown Ter)
Length: 0.53 miles
Directions: E-W, SE-NW
Address range: 200 to 299
Directions: E-W, SE-NW
Address range: 200 to 299
Brookbank Rd
Length: 0.33 miles
Directions: E-W, N-S, SW-NE
Address range: 1 to 99
Directions: E-W, N-S, SW-NE
Address range: 1 to 99
Honeywood Rd
Length: 0.28 miles
Directions: E-W, N-S, SE-NW, SW-NE
Address range: 1 to 99
Directions: E-W, N-S, SE-NW, SW-NE
Address range: 1 to 99
Irving Ln
Length: 0.27 miles
Directions: E-W, N-S, SE-NW, SW-NE
Address range: 1 to 99
Directions: E-W, N-S, SE-NW, SW-NE
Address range: 1 to 99
Amber Valley Dr
Length: 0.20 miles
Directions: N-S, SW-NE
Address range: 100 to 199
Directions: N-S, SW-NE
Address range: 100 to 199
Fallen Leaf Ter
Length: 0.18 miles
Directions: E-W, N-S, SE-NW, SW-NE
Address range: 1 to 99
Directions: E-W, N-S, SE-NW, SW-NE
Address range: 1 to 99
St James Ct
Length: 0.17 miles
Directions: E-W, N-S, SE-NW, SW-NE
Address range: 1 to 99
Directions: E-W, N-S, SE-NW, SW-NE
Address range: 1 to 99
Kingingwood Ln (Singingwood Ln)
Length: 0.13 miles
Direction: SE-NW
Address range: 1 to 99
Direction: SE-NW
Address range: 1 to 99
Silver Oak Ter
Length: 0.12 miles
Directions: N-S, SW-NE
Address range: 100 to 199
Directions: N-S, SW-NE
Address range: 100 to 199
Miner Rd
Length: 0.11 miles
Direction: SW-NE
Address range: 452 to 517
Direction: SW-NE
Address range: 452 to 517
Candle Ter
Length: 0.09 miles
Directions: N-S, SE-NW
Address range: 1 to 99
Directions: N-S, SE-NW
Address range: 1 to 99
Yarrow Valley Ln
Length: 0.08 miles
Direction: E-W
Address range: 1 to 99
Direction: E-W
Address range: 1 to 99
Moss Bridge Ln
Length: 0.06 miles
Directions: E-W, SW-NE
Address range: 75 to 99
Directions: E-W, SW-NE
Address range: 75 to 99
Happy Valley Rd
Length: 0.05 miles
Directions: N-S, SE-NW
Directions: N-S, SE-NW
Irving Ct
Length: 0.04 miles
Directions: N-S, SE-NW
Address range: 1 to 99
Directions: N-S, SE-NW
Address range: 1 to 99
Other features:
Lauterwasser Crk
Length: 1.07 miles
Directions: E-W, N-S, SE-NW, SW-NE
Directions: E-W, N-S, SE-NW, SW-NE