Sullivan Corridor (Sullivan) neighborhood in Daly City, California (CA), 94014, 94015 detailed profile
Settings
X


Business Search - 14 Million verified businesses
Area: 0.582 square miles
Population: 6,687
Population density:
| Sullivan Corridor (Sullivan): | 11,484 people per square mile |
| Daly City: | 13,224 people per square mile |

- 4,09856.1%Asian
- 1,11315.2%White
- 1,04414.3%Hispanic or Latino
- 5557.6%Some other race
- 2503.4%Two or more races
- 2283.1%Black
- 200.3%American Indian

Median household income in 2022:
| Sullivan Corridor (Sullivan): | $113,024 |
| Daly City: | $109,227 |
Distribution of median household income
![Distribution of median household income]()
- 145Less than $10,000
- 203$10,000 to $19,999
- 200$20,000 to $29,999
- 212$30,000 to $39,999
- 156$40,000 to $49,999
- 178$50,000 to $59,999
- 178$60,000 to $74,999
- 285$75,000 to $99,999
- 225$100,000 to $124,999
- 250$125,000 to $149,999
- 283$150,000 to $199,999
- 409$200,000 or more

Distribution of owner-occupied house/condo value
![Distribution of owner-occupied house/condo value]()
- 61Less than $50,000
- 23$50,000 to $99,999
- 107$100,000 to $149,999
- 10$150,000 to $199,999
- 3$200,000 to $249,999
- 12$250,000 to $299,999
- 57$300,000 to $399,999
- 64$400,000 to $499,999
- 125$500,000 to $749,999
- 263$750,000 to $999,999
- 931$1,000,000 or more

Distribution of rent paid by renters
![Distribution of rent paid by renters]()
- 27$100 to $199
- 4$200 to $299
- 128$300 to $399
- 45$600 to $699
- 24$700 to $799
- 246$800 to $899
- 65$900 to $999
- 70$1,000 to $1,249
- 81$1,250 to $1,499
- 102$1,500 to $1,999
- 976$2,000 or more

Median rent in 2022:
| Sullivan Corridor (Sullivan): | $2,502 |
| Daly City: | $2,001 |
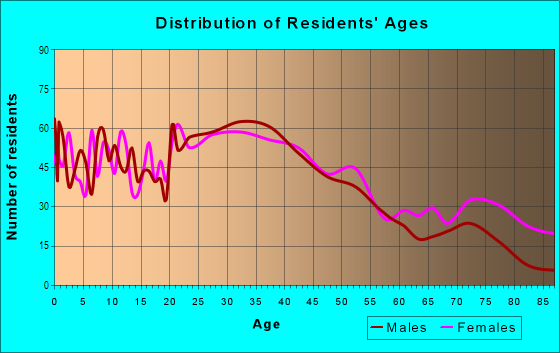
| Males: | 3,178 |
| Females: | 3,509 |
Males:
| This neighborhood: | 40.7 years |
| Whole city: | 40.9 years |
| This neighborhood: | 42.6 years |
| Whole city: | 44.8 years |
Average household size:
| Sullivan Corridor (Sullivan): | 3.0 people |
| Daly City: | 3.1 people |
Percentage of family households:
| Sullivan Corridor (Sullivan): | 49.2% |
| Daly City: | 40.3% |
| Here: | 57.6% |
| Daly City: | 50.3% |
Percentage of married-couple families with children (among all households):
| Sullivan Corridor (Sullivan): | 28.8% |
| Daly City: | 23.9% |
Percentage of single-mother households (among all households):
| Sullivan Corridor (Sullivan): | 2.9% |
| Daly City: | 5.7% |
Percentage of never married males 15 years old and over:
Percentage of never married females 15 years old and over:
| Sullivan Corridor (Sullivan): | 17.5% |
| Daly City: | 22.6% |
Percentage of never married females 15 years old and over:
| Sullivan Corridor (Sullivan): | 18.6% |
| city: | 17.9% |
Percentage of people that speak English not well or not at all:
| Sullivan Corridor (Sullivan): | 10.8% |
| Daly City: | 11.2% |
Percentage of people born in this state:
Percentage of people born in another U.S. state:
Percentage of native residents but born outside the U.S.:
Percentage of foreign born residents:
| Here: | 41.4% |
| Daly City: | 41.1% |
Percentage of people born in another U.S. state:
| Sullivan Corridor (Sullivan): | 6.7% |
| Daly City: | 5.1% |
Percentage of native residents but born outside the U.S.:
| Here: | 1.8% |
| city: | 1.8% |
Percentage of foreign born residents:
| Here: | 50.1% |
| Daly City: | 52.0% |

Owner-occupied
Renter-occupied


- Rooms in owner-occupied houses and condos in Sullivan Corridor <
> - 821 room
- 2842 rooms
- 1393 rooms
- 2414 rooms
- 6375 rooms
- 1356 rooms
- 1777 rooms
- 2398 rooms
- 1029+ rooms

- Rooms in renter-occupied apartments in Sullivan Corridor <
> - 2501 room
- 1592 rooms
- 3423 rooms
- 1804 rooms
- 1115 rooms
- 836 rooms
- 1847 rooms
- 1228 rooms
- 2759+ rooms
Owner-occupied
Renter-occupied

- Bedrooms in owner-occupied houses and condos in Sullivan Corridor <
> - 82no bedroom
- 1961 bedroom
- 2322 bedrooms
- 6393 bedrooms
- 2384 bedrooms
- 1905+ bedrooms

- Bedrooms in renter-occupied apartments in Sullivan Corridor <
> - 275no bedroom
- 4631 bedroom
- 3602 bedrooms
- 1893 bedrooms
- 764 bedrooms
- 1395+ bedrooms
Average number of cars or other vehicles available in houses/condos:
Average number of cars or other vehicles available in apartments:
| This neighborhood: | |
| Daly City: |
Average number of cars or other vehicles available in apartments:
| Here: | 1.8 |
| city: | 1.6 |
Percentage of units with a mortgage:
| Sullivan Corridor (Sullivan): | 67.1% |
| Daly City: | 61.0% |

- Year house built in Sullivan Corridor <
> - 1122020 or later
- 1792010 to 2019
- 2032000 to 2009
- 3041990 to 1999
- 1421980 to 1989
- 4541970 to 1979
- 3911960 to 1969
- 7171950 to 1959
- 4491940 to 1949
- 451939 or earlier

City-data.com crime index for city in 2020 (higher means more crime):
| City: | 129.4 |
| U.S. average: | 219.5 |
Travel time to work (commute)
![Travel time to work (commute)]()
- 107Less than 5 minutes
- 2705 to 9 minutes
- 41310 to 14 minutes
- 81415 to 19 minutes
- 35120 to 24 minutes
- 12525 to 29 minutes
- 66530 to 34 minutes
- 10635 to 39 minutes
- 21140 to 44 minutes
- 33545 to 59 minutes
- 28860 to 89 minutes
- 14890 or more minutes

Means of transportation to work
![Means of transportation to work]()
- 58.4%2,097Drove a car alone
- 13.0%465Carpooled
- 4.7%170Bus
- 5.9%211Subway or elevated rail
- 1.8%63Long-distance train or commuter rail
- 2.0%71Light rail, streetcar or trolley
- 2.4%87Taxi
- 1.0%37Motorcycle
- 0.0%1Bicycle
- 3.1%111Walked
- 3.2%114Other means
- 13.4%481Worked at home

Time leaving home to go to work
![Time leaving home to go to work]()
- 27712:00 a.m. to 4:59 a.m.
- 1275:00 a.m. to 5:29 a.m.
- 945:30 a.m. to 5:59 a.m.
- 1666:00 a.m. to 6:29 a.m.
- 3476:30 a.m. to 6:59 a.m.
- 4717:00 a.m. to 7:29 a.m.
- 3447:30 a.m. to 7:59 a.m.
- 4368:00 a.m. to 8:29 a.m.
- 1158:30 a.m. to 8:59 a.m.
- 3669:00 a.m. to 9:59 a.m.
- 19810:00 a.m. to 10:59 a.m.
- 7611:00 a.m. to 11:59 a.m.
- 36212:00 p.m. to 3:59 p.m.
- 3414:00 p.m. to 11:59 p.m.

Occupations of males:
- Percentage of males in management occupations (except farmers):
Here: 8.6% city: 7.8%
- Percentage of males in business and financial operations occupations:
Here: 6.2% city: 4.6%
- Percentage of males in computer and mathematical occupations:
Here: 5.4% city: 5.8%
- Percentage of males in architecture and engineering occupations:
Here: 1.3% city: 2.2%
- Percentage of males in life, physical, and social science occupations:
Here: 1.1% city: 1.0%
- Percentage of males in education, training, and library occupations:
Here: 1.8% city: 2.2%
- Percentage of males in arts, design, entertainment, sports, and media occupations:
Here: 3.5% city: 3.3%
- Percentage of males in healthcare practitioners and technical occupations:
Here: 4.5% city: 4.3%
- Percentage of males in service occupations:
Here: 19.6% city: 17.3%
- Percentage of males in sales and office occupations:
Here: 17.3% city: 17.7%
- Percentage of males in construction, extraction, and maintenance occupations:
Here: 6.9% city: 8.6%
- Percentage of males in production occupations:
Here: 3.5% city: 4.3%
- Percentage of males in transportation occupations:
Here: 8.4% city: 9.3%
- Percentage of males in material moving occupations:
Here: 8.5% city: 4.8%
Occupations of females:
- Percentage of females in management occupations (except farmers):
Here: 8.7% city: 8.1%
- Percentage of females in business and financial operations occupations:
Here: 6.2% city: 8.4%
- Percentage of females in architecture and engineering occupations:
Here: 1.7% city: 1.4%
- Percentage of females in community and social services occupations:
Here: 2.1% city: 1.9%
- Percentage of females in education, training, and library occupations:
Here: 3.6% city: 5.1%
- Percentage of females in arts, design, entertainment, sports, and media occupations:
Here: 2.4% city: 2.0%
- Percentage of females in healthcare practitioners and technical occupations:
Here: 13.3% city: 10.8%
- Percentage of females in service occupations:
Here: 22.9% city: 25.2%
- Percentage of females in sales and office occupations:
Here: 29.7% city: 27.7%
- Percentage of females in production occupations:
Here: 4.4% city: 1.9%
- Percentage of females in material moving occupations:
Here: 2.9% city: 2.5%
Percentage of people 16-64 in Armed Forces:
| Sullivan Corridor (Sullivan): | 0.0% |
| Daly City: | 0.3% |
Education in this neighborhood (subdivision or community):
- Percentage of people 3 years and older in K-12 schools:
Sullivan Corridor (Sullivan): 19.1% Daly City: 11.4%
- Percentage of people 3 years and older in undergraduate colleges:
Sullivan Corridor (Sullivan): 4.8% Daly City: 6.1%
- Percentage of people 3 years and older in grad. or professional schools:
Sullivan Corridor (Sullivan): 3.4% Daly City: 2.0%
- Percentage of students K-12 enrolled in private schools:
Sullivan Corridor (Sullivan): 62.3% Daly City: 20.0%
Percentage of population below poverty level:
| Sullivan Corridor (Sullivan): | 5.6% |
| Daly City: | 11.3% |
Median year renter moved in (as recorded in 2022):
| Sullivan Corridor (Sullivan): | 2015 |
| Daly City: | 2019 |
Percentage of married-couple families with both working:
| Sullivan Corridor (Sullivan): | 76.1% |
| Daly City: | 65.5% |

- 44.3%Electricity
- 43.7%Utility gas
- 4.6%No fuel used
- 3.4%Other fuel
- 2.9%Solar energy
- 1.1%Bottled, tank, or LP gas
Limited-access highways (interstate or state) in this neighborhood:
Junipero Serra Fwy (I- 280)
Length: 2.49 miles
Directions: N-S, SE-NW, SW-NE
Address range: 800 to 829
Directions: N-S, SE-NW, SW-NE
Address range: 800 to 829
Highways in this neighborhood:
State Hwy 1 (Coast Hwy, Cabrillo Hwy)
Length: 1.15 miles
Directions: E-W, N-S, SW-NE
Directions: E-W, N-S, SW-NE
Roads and streets:
Sullivan Ave
Length: 1.74 miles
Directions: E-W, N-S, SE-NW, SW-NE
Address range: 2 to 2099
Directions: E-W, N-S, SE-NW, SW-NE
Address range: 2 to 2099
State Hwy 1
Length: 0.94 miles
Directions: E-W, N-S, SE-NW, SW-NE
Directions: E-W, N-S, SE-NW, SW-NE
Cerro Dr
Length: 0.60 miles
Directions: E-W, N-S, SE-NW, SW-NE
Address range: 1 to 399
Directions: E-W, N-S, SE-NW, SW-NE
Address range: 1 to 399
Edgeworth Ave
Length: 0.58 miles
Direction: N-S
Address range: 1 to 1699
Direction: N-S
Address range: 1 to 1699
Junipero Serra Blvd
Length: 0.57 miles
Directions: E-W, N-S, SE-NW, SW-NE
Address range: 2203 to 2935
Directions: E-W, N-S, SE-NW, SW-NE
Address range: 2203 to 2935
Southgate Ave
Length: 0.50 miles
Directions: E-W, SE-NW
Address range: 1400 to 1599
Directions: E-W, SE-NW
Address range: 1400 to 1599
St Francis Blvd (Saint Francis Blvd)
Length: 0.44 miles
Directions: N-S, SW-NE
Address range: 1 to 756
Directions: N-S, SW-NE
Address range: 1 to 756
Washington St
Length: 0.38 miles
Direction: E-W
Address range: 176 to 699
Direction: E-W
Address range: 176 to 699
89th St
Length: 0.35 miles
Direction: E-W
Address range: 1 to 444
Direction: E-W
Address range: 1 to 444
88th St
Length: 0.35 miles
Direction: E-W
Address range: 1 to 399
Direction: E-W
Address range: 1 to 399
91st St
Length: 0.34 miles
Direction: E-W
Address range: 100 to 499
Direction: E-W
Address range: 100 to 499
92nd St
Length: 0.34 miles
Directions: E-W, N-S, SE-NW
Address range: 1 to 499
Directions: E-W, N-S, SE-NW
Address range: 1 to 499
San Fernando Way
Length: 0.34 miles
Directions: E-W, N-S, SW-NE
Address range: 1 to 199
Directions: E-W, N-S, SW-NE
Address range: 1 to 199
90th St
Length: 0.33 miles
Direction: E-W
Address range: 1 to 499
Direction: E-W
Address range: 1 to 499
Clarinada Ave
Length: 0.32 miles
Directions: E-W, SE-NW, SW-NE
Address range: 512 to 598
Directions: E-W, SE-NW, SW-NE
Address range: 512 to 598
Belhaven Ct
Length: 0.26 miles
Directions: E-W, SE-NW
Address range: 1 to 99
Directions: E-W, SE-NW
Address range: 1 to 99
Bryant St
Length: 0.25 miles
Direction: N-S
Address range: 1500 to 1699
Direction: N-S
Address range: 1500 to 1699
Annie St
Length: 0.25 miles
Direction: N-S
Address range: 1300 to 1699
Direction: N-S
Address range: 1300 to 1699
87th St
Length: 0.24 miles
Direction: E-W
Address range: 100 to 310
Direction: E-W
Address range: 100 to 310
Escuela Dr
Length: 0.24 miles
Directions: E-W, N-S, SE-NW
Address range: 1 to 99
Directions: E-W, N-S, SE-NW
Address range: 1 to 99
Sweetwood Dr
Length: 0.23 miles
Directions: N-S, SW-NE
Address range: 1300 to 1599
Directions: N-S, SW-NE
Address range: 1300 to 1599
Pierce St
Length: 0.21 miles
Direction: E-W
Address range: 100 to 599
Direction: E-W
Address range: 100 to 599
el Dorado Dr
Length: 0.20 miles
Direction: N-S
Address range: 400 to 499
Direction: N-S
Address range: 400 to 499
Santa Elena Ave
Length: 0.19 miles
Direction: E-W
Address range: 1 to 99
Direction: E-W
Address range: 1 to 99
Eastmoor Ave
Length: 0.18 miles
Direction: E-W
Address range: 400 to 499
Direction: E-W
Address range: 400 to 499
Santa Paula Dr
Length: 0.16 miles
Directions: E-W, N-S, SE-NW
Address range: 100 to 199
Directions: E-W, N-S, SE-NW
Address range: 100 to 199
Garden Ln
Length: 0.16 miles
Direction: E-W
Address range: 1 to 99
Direction: E-W
Address range: 1 to 99
Village Ln
Length: 0.16 miles
Direction: E-W
Address range: 1 to 298
Direction: E-W
Address range: 1 to 298
San Pedro Rd
Length: 0.13 miles
Directions: E-W, SW-NE
Address range: 300 to 449
Directions: E-W, SW-NE
Address range: 300 to 449
School St
Length: 0.08 miles
Direction: E-W
Address range: 240 to 399
Direction: E-W
Address range: 240 to 399
Garden Gate Way
Length: 0.08 miles
Direction: E-W
Address range: 1 to 199
Direction: E-W
Address range: 1 to 199
Briggs St
Length: 0.07 miles
Direction: N-S
Address range: 1500 to 1698
Direction: N-S
Address range: 1500 to 1698
Amelia M Teglia Blvd
Length: 0.06 miles
Direction: SE-NW
Address range: 1 to 6
Direction: SE-NW
Address range: 1 to 6
Savage Way
Length: 0.05 miles
Direction: N-S
Direction: N-S
Cerro Ct
Length: 0.04 miles
Direction: E-W
Address range: 300 to 399
Direction: E-W
Address range: 300 to 399
Railroad features:
Union Pacific RR
Length: 0.30 miles
Direction: N-S
Direction: N-S
Bart
Length: 0.23 miles
Directions: N-S, SE-NW, SW-NE
Directions: N-S, SE-NW, SW-NE