Stockton neighborhood in San Diego, California (CA), 92102 detailed profile
Settings
X


Business Search - 14 Million verified businesses
Area: 0.382 square miles
Population: 4,249
Population density:
| Stockton: | 11,110 people per square mile |
| San Diego: | 4,258 people per square mile |

- 3,34977.5%Hispanic or Latino
- 51511.9%White
- 3047.0%Black
- 902.1%Asian
- 651.5%Two or more races

Median household income in 2022:
| Stockton: | $56,244 |
| San Diego: | $100,010 |
Distribution of median household income
![Distribution of median household income]()
- 132Less than $10,000
- 276$10,000 to $19,999
- 109$20,000 to $29,999
- 266$30,000 to $39,999
- 274$40,000 to $49,999
- 104$50,000 to $59,999
- 173$60,000 to $74,999
- 131$75,000 to $99,999
- 145$100,000 to $124,999
- 135$125,000 to $149,999
- 73$150,000 to $199,999

Distribution of owner-occupied house/condo value
![Distribution of owner-occupied house/condo value]()
- 41$200,000 to $249,999
- 91$300,000 to $399,999
- 205$400,000 to $499,999
- 230$500,000 to $749,999
- 68$750,000 to $999,999
- 138$1,000,000 or more

Distribution of rent paid by renters
![Distribution of rent paid by renters]()
- 70$200 to $299
- 224$500 to $599
- 44$600 to $699
- 286$800 to $899
- 114$900 to $999
- 92$1,000 to $1,249
- 179$1,250 to $1,499
- 271$1,500 to $1,999
- 286$2,000 or more

Median rent in 2022:
| Stockton: | $1,538 |
| San Diego: | $1,971 |
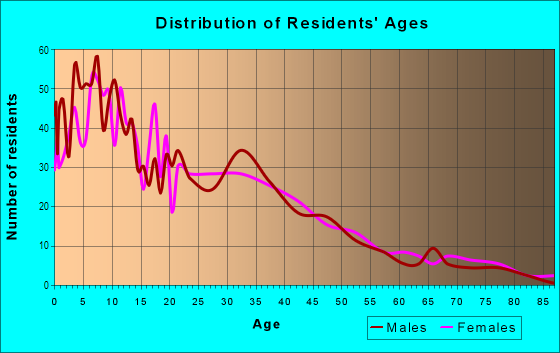
| Males: | 2,003 |
| Females: | 2,245 |
Males:
| This neighborhood: | 29.7 years |
| Whole city: | 35.4 years |
| This neighborhood: | 33.7 years |
| Whole city: | 37.2 years |
Average household size:
| Stockton: | 3.5 people |
| San Diego: | 2.5 people |
Percentage of family households:
| Stockton: | 62.5% |
| San Diego: | 41.7% |
| Here: | 43.6% |
| San Diego: | 43.2% |
Percentage of married-couple families with children (among all households):
| Stockton: | 16.0% |
| San Diego: | 27.8% |
Percentage of single-mother households (among all households):
| Stockton: | 23.3% |
| San Diego: | 7.9% |
Percentage of never married males 15 years old and over:
Percentage of never married females 15 years old and over:
| Stockton: | 23.7% |
| San Diego: | 23.4% |
Percentage of never married females 15 years old and over:
| Stockton: | 24.1% |
| city: | 18.8% |
Percentage of people that speak English not well or not at all:
| Stockton: | 14.1% |
| San Diego: | 5.9% |
Percentage of people born in this state:
Percentage of people born in another U.S. state:
Percentage of native residents but born outside the U.S.:
Percentage of foreign born residents:
| Here: | 60.9% |
| San Diego: | 48.1% |
Percentage of people born in another U.S. state:
| Stockton: | 8.6% |
| San Diego: | 24.9% |
Percentage of native residents but born outside the U.S.:
| Here: | 0.2% |
| city: | 2.4% |
Percentage of foreign born residents:
| Here: | 30.2% |
| San Diego: | 24.6% |

Owner-occupied
Renter-occupied


- Rooms in owner-occupied houses and condos in Stockton
- 01 room
- 02 rooms
- 03 rooms
- 374 rooms
- 1695 rooms
- 1576 rooms
- 527 rooms
- 08 rooms
- 969+ rooms

- Rooms in renter-occupied apartments in Stockton
- 851 room
- 1492 rooms
- 1833 rooms
- 2914 rooms
- 2075 rooms
- 1196 rooms
- 287 rooms
- 08 rooms
- 09+ rooms
Owner-occupied
Renter-occupied

- Bedrooms in owner-occupied houses and condos in Stockton
- 0no bedroom
- 01 bedroom
- 402 bedrooms
- 2413 bedrooms
- 874 bedrooms
- 645+ bedrooms

- Bedrooms in renter-occupied apartments in Stockton
- 85no bedroom
- 1581 bedroom
- 4002 bedrooms
- 2923 bedrooms
- 1974 bedrooms
- 05+ bedrooms
Average number of cars or other vehicles available in houses/condos:
Average number of cars or other vehicles available in apartments:
| This neighborhood: | 1.9 |
| San Diego: | 2.1 |
Average number of cars or other vehicles available in apartments:
| Here: | 1.6 |
| city: | 1.6 |
Percentage of units with a mortgage:
| Stockton: | 68.5% |
| San Diego: | 69.2% |
Average estimated value of detached houses in 2022 (66.4% of all units):
| Stockton: | $664,053 |
| San Diego: | $1,227,596 |

- Year house built in Stockton
- 02020 or later
- 372010 to 2019
- 1522000 to 2009
- 861990 to 1999
- 471980 to 1989
- 1211970 to 1979
- 3521960 to 1969
- 851950 to 1959
- 741940 to 1949
- 6411939 or earlier

City-data.com crime index for city in 2020 (higher means more crime):
| City: | 197.8 |
| U.S. average: | 219.5 |
Travel time to work (commute)
![Travel time to work (commute)]()
- 475 to 9 minutes
- 20910 to 14 minutes
- 50415 to 19 minutes
- 23420 to 24 minutes
- 12825 to 29 minutes
- 11630 to 34 minutes
- 1535 to 39 minutes
- 1940 to 44 minutes
- 10245 to 59 minutes
- 2190 or more minutes

Means of transportation to work
![Means of transportation to work]()
- 75.5%1,258Drove a car alone
- 16.1%268Carpooled
- 4.6%76Bus
- 9.8%164Light rail, streetcar or trolley
- 8.2%136Walked
- 19.7%328Other means
- 3.2%53Worked at home

Time leaving home to go to work
![Time leaving home to go to work]()
- 6812:00 a.m. to 4:59 a.m.
- 985:00 a.m. to 5:29 a.m.
- 665:30 a.m. to 5:59 a.m.
- 406:00 a.m. to 6:29 a.m.
- 906:30 a.m. to 6:59 a.m.
- 1767:00 a.m. to 7:29 a.m.
- 1047:30 a.m. to 7:59 a.m.
- 1528:00 a.m. to 8:29 a.m.
- 878:30 a.m. to 8:59 a.m.
- 1519:00 a.m. to 9:59 a.m.
- 2110:00 a.m. to 10:59 a.m.
- 4411:00 a.m. to 11:59 a.m.
- 15412:00 p.m. to 3:59 p.m.
- 1284:00 p.m. to 11:59 p.m.

Occupations of males:
- Percentage of males in management occupations (except farmers):
Here: 6.0% city: 12.7%
- Percentage of males in computer and mathematical occupations:
Here: 2.5% city: 8.8%
- Percentage of males in architecture and engineering occupations:
Here: 4.8% city: 6.5%
- Percentage of males in community and social services occupations:
Here: 9.7% city: 1.0%
- Percentage of males in service occupations:
Here: 14.8% city: 14.6%
- Percentage of males in sales and office occupations:
Here: 9.5% city: 13.9%
- Percentage of males in construction, extraction, and maintenance occupations:
Here: 31.2% city: 5.9%
- Percentage of males in production occupations:
Here: 2.0% city: 4.6%
- Percentage of males in transportation occupations:
Here: 9.2% city: 3.9%
- Percentage of males in material moving occupations:
Here: 2.8% city: 3.3%
Occupations of females:
- Percentage of females in community and social services occupations:
Here: 6.6% city: 2.5%
- Percentage of females in education, training, and library occupations:
Here: 1.5% city: 8.2%
- Percentage of females in arts, design, entertainment, sports, and media occupations:
Here: 8.7% city: 2.9%
- Percentage of females in service occupations:
Here: 47.0% city: 19.9%
- Percentage of females in sales and office occupations:
Here: 27.2% city: 22.0%
- Percentage of females in production occupations:
Here: 8.4% city: 2.8%
Education in this neighborhood (subdivision or community):
- Percentage of people 3 years and older in K-12 schools:
Stockton: 36.4% San Diego: 13.8%
- Percentage of people 3 years and older in undergraduate colleges:
Stockton: 8.1% San Diego: 8.5%
- Percentage of people 3 years and older in grad. or professional schools:
Stockton: 1.9% San Diego: 2.3%
- Percentage of students K-12 enrolled in private schools:
Stockton: 6.4% San Diego: 13.6%
Percentage of population below poverty level:
| Stockton: | 21.4% |
| San Diego: | 11.3% |
Median year owner moved in (as recorded in 2022):
Median year renter moved in (as recorded in 2022):
| Stockton: | 1999 |
| San Diego: | 2010 |
Median year renter moved in (as recorded in 2022):
| Stockton: | 2016 |
| San Diego: | 2020 |
Percentage of married-couple families with both working:
| Stockton: | 84.6% |
| San Diego: | 66.0% |

- 47.9%Utility gas
- 31.9%Electricity
- 13.2%No fuel used
- 3.8%Solar energy
- 3.2%Wood
Limited-access highways (interstate or state) in this neighborhood:
Escondido Fwy (I- 15)
Length: 1.24 miles
Directions: N-S, SW-NE
Directions: N-S, SW-NE
State Hwy 94 (Martin Luther King Jr Fwy)
Length: 0.83 miles
Directions: E-W, SW-NE
Directions: E-W, SW-NE
Roads and streets:
33rd St
Length: 0.61 miles
Directions: N-S, SE-NW, SW-NE
Address range: 100 to 999
Directions: N-S, SE-NW, SW-NE
Address range: 100 to 999
Market St
Length: 0.60 miles
Directions: E-W, SW-NE
Address range: 3100 to 3431
Directions: E-W, SW-NE
Address range: 3100 to 3431
G St
Length: 0.56 miles
Direction: E-W
Address range: 3010 to 3399
Direction: E-W
Address range: 3010 to 3399
32nd St
Length: 0.56 miles
Directions: N-S, SE-NW
Address range: 100 to 899
Directions: N-S, SE-NW
Address range: 100 to 899
31st St
Length: 0.51 miles
Direction: N-S
Address range: 100 to 799
Direction: N-S
Address range: 100 to 799
K St
Length: 0.47 miles
Direction: E-W
Address range: 3001 to 3499
Direction: E-W
Address range: 3001 to 3499
Island Ave
Length: 0.45 miles
Direction: E-W
Address range: 3100 to 3499
Direction: E-W
Address range: 3100 to 3499
Imperial Ave
Length: 0.43 miles
Direction: E-W
Address range: 3100 to 3352
Direction: E-W
Address range: 3100 to 3352
F St
Length: 0.37 miles
Direction: E-W
Address range: 3024 to 3399
Direction: E-W
Address range: 3024 to 3399
L St
Length: 0.37 miles
Direction: E-W
Address range: 3100 to 3374
Direction: E-W
Address range: 3100 to 3374
E St
Length: 0.33 miles
Direction: E-W
Address range: 3101 to 3599
Direction: E-W
Address range: 3101 to 3599
J St
Length: 0.31 miles
Direction: E-W
Address range: 3200 to 3499
Direction: E-W
Address range: 3200 to 3499
34th St
Length: 0.23 miles
Direction: N-S
Address range: 300 to 951
Direction: N-S
Address range: 300 to 951
Pickwick St
Length: 0.16 miles
Directions: E-W, N-S, SW-NE
Address range: 3300 to 3499
Directions: E-W, N-S, SW-NE
Address range: 3300 to 3499
Spring Garden Pl
Length: 0.16 miles
Directions: E-W, N-S
Address range: 3300 to 3399
Directions: E-W, N-S
Address range: 3300 to 3399
Bancroft St
Length: 0.12 miles
Direction: N-S
Address range: 400 to 599
Direction: N-S
Address range: 400 to 599
Mc Larens Ln
Length: 0.12 miles
Direction: E-W
Address range: 3200 to 3299
Direction: E-W
Address range: 3200 to 3299
Broadway
Length: 0.09 miles
Directions: E-W, N-S, SE-NW, SW-NE
Directions: E-W, N-S, SE-NW, SW-NE
30th Pl
Length: 0.07 miles
Direction: N-S
Address range: 600 to 799
Direction: N-S
Address range: 600 to 799
Sunrise St
Length: 0.06 miles
Direction: SW-NE
Address range: 3300 to 3399
Direction: SW-NE
Address range: 3300 to 3399
Railroad features:
San Diego and Arizona Eastern Rlwy (San Diego Trolley)
Length: 0.47 miles
Directions: E-W, N-S, SE-NW, SW-NE
Directions: E-W, N-S, SE-NW, SW-NE
Other features:
Chollas Crk
Length: 0.73 miles
Directions: E-W, N-S, SE-NW, SW-NE
Directions: E-W, N-S, SE-NW, SW-NE