Sterling Downs neighborhood in Belmont, Aghnajane, California (CA), 94002, 94403 detailed profile
Settings
X


Business Search - 14 Million verified businesses
Area: 0.523 square miles
Population: 4,613
Population density:
| Sterling Downs: | 8,821 people per square mile |
| Belmont: | 6,147 people per square mile |

- 2,00739.2%White
- 1,53129.9%Asian
- 70613.8%Native Hawaiian and Other
Pacific Islander - 57411.2%Hispanic or Latino
- 1783.5%Two or more races
- 571.1%Some other race
- 470.9%Black
- 220.4%American Indian

Distribution of median household income
![Distribution of median household income]()
- 136Less than $10,000
- 520$10,000 to $19,999
- 231$20,000 to $29,999
- 104$30,000 to $39,999
- 147$40,000 to $49,999
- 88$50,000 to $59,999
- 108$60,000 to $74,999
- 123$75,000 to $99,999
- 93$100,000 to $124,999
- 232$125,000 to $149,999
- 247$150,000 to $199,999
- 689$200,000 or more

Distribution of owner-occupied house/condo value
![Distribution of owner-occupied house/condo value]()
- 58Less than $50,000
- 32$50,000 to $99,999
- 64$100,000 to $149,999
- 7$150,000 to $199,999
- 11$300,000 to $399,999
- 23$400,000 to $499,999
- 77$500,000 to $749,999
- 114$750,000 to $999,999
- 687$1,000,000 or more

Distribution of rent paid by renters
![Distribution of rent paid by renters]()
- 11$100 to $199
- 59$200 to $299
- 484$300 to $399
- 103$400 to $499
- 35$800 to $899
- 76$1,000 to $1,249
- 51$1,250 to $1,499
- 131$1,500 to $1,999
- 1,040$2,000 or more

Median rent in 2022:
| Sterling Downs: | $2,885 |
| Belmont: | $2,001 |
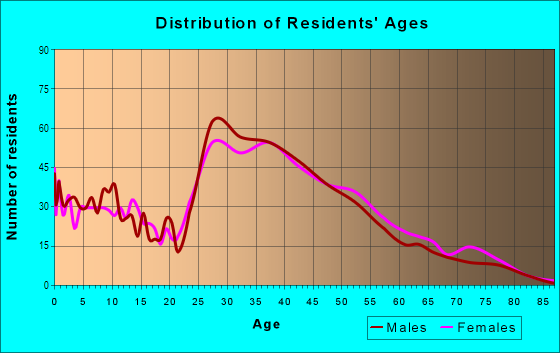
| Males: | 2,166 |
| Females: | 2,446 |
Males:
| This neighborhood: | 40.5 years |
| Whole city: | 40.1 years |
| This neighborhood: | 45.1 years |
| Whole city: | 41.5 years |
Average household size:
| Sterling Downs: | 4.4 people |
| Belmont: | 2.5 people |
Percentage of family households:
| Sterling Downs: | 42.7% |
| Belmont: | 53.9% |
| Here: | 53.2% |
| Belmont: | 60.1% |
Percentage of married-couple families with children (among all households):
| Sterling Downs: | 42.5% |
| Belmont: | 34.5% |
Percentage of single-mother households (among all households):
| Sterling Downs: | 1.7% |
| Belmont: | 3.1% |
Percentage of never married males 15 years old and over:
Percentage of never married females 15 years old and over:
| Sterling Downs: | 14.3% |
| Belmont: | 15.9% |
Percentage of never married females 15 years old and over:
| Sterling Downs: | 18.8% |
| city: | 13.0% |
Percentage of people that speak English not well or not at all:
| Sterling Downs: | 5.0% |
| Belmont: | 2.5% |
Percentage of people born in this state:
Percentage of people born in another U.S. state:
Percentage of native residents but born outside the U.S.:
Percentage of foreign born residents:
| Here: | 44.8% |
| Belmont: | 49.1% |
Percentage of people born in another U.S. state:
| Sterling Downs: | 15.4% |
| Belmont: | 19.5% |
Percentage of native residents but born outside the U.S.:
| Here: | 1.6% |
| city: | 1.7% |
Percentage of foreign born residents:
| Here: | 38.2% |
| Belmont: | 29.7% |

Owner-occupied
Renter-occupied


- Rooms in owner-occupied houses and condos in Sterling Downs
- 261 room
- 362 rooms
- 843 rooms
- 1464 rooms
- 2105 rooms
- 876 rooms
- 1137 rooms
- 1728 rooms
- 629+ rooms

- Rooms in renter-occupied apartments in Sterling Downs
- 1641 room
- 3982 rooms
- 4483 rooms
- 2494 rooms
- 565 rooms
- 856 rooms
- 477 rooms
- 268 rooms
- 619+ rooms
Owner-occupied
Renter-occupied

- Bedrooms in owner-occupied houses and condos in Sterling Downs
- 26no bedroom
- 1101 bedroom
- 1592 bedrooms
- 3913 bedrooms
- 1894 bedrooms
- 1185+ bedrooms

- Bedrooms in renter-occupied apartments in Sterling Downs
- 164no bedroom
- 6081 bedroom
- 4342 bedrooms
- 1373 bedrooms
- 694 bedrooms
- 935+ bedrooms
Average number of cars or other vehicles available in houses/condos:
Average number of cars or other vehicles available in apartments:
| This neighborhood: | 2.0 |
| Belmont: | 2.2 |
Average number of cars or other vehicles available in apartments:
| Here: | 1.3 |
| city: | 1.4 |
Percentage of units with a mortgage:
| Sterling Downs: | 66.5% |
| Belmont: | 71.5% |
Average estimated value of detached houses in 2022 (37.6% of all units):
| Sterling Downs: | $1,648,034 |
| California: | $988,808 |

- Year house built in Sterling Downs
- 02020 or later
- 792010 to 2019
- 982000 to 2009
- 2391990 to 1999
- 2491980 to 1989
- 4791970 to 1979
- 5431960 to 1969
- 5041950 to 1959
- 1151940 to 1949
- 461939 or earlier

City-data.com crime index for city in 2020 (higher means more crime):
| City: | 138.7 |
| U.S. average: | 219.5 |
Travel time to work (commute)
![Travel time to work (commute)]()
- 39Less than 5 minutes
- 895 to 9 minutes
- 38610 to 14 minutes
- 37815 to 19 minutes
- 18020 to 24 minutes
- 15225 to 29 minutes
- 32630 to 34 minutes
- 19335 to 39 minutes
- 10140 to 44 minutes
- 18345 to 59 minutes
- 26160 to 89 minutes
- 7790 or more minutes

Means of transportation to work
![Means of transportation to work]()
- 51.6%1,237Drove a car alone
- 6.2%149Carpooled
- 4.1%98Bus
- 5.0%119Subway or elevated rail
- 5.1%122Long-distance train or commuter rail
- 2.8%66Light rail, streetcar or trolley
- 0.4%9Taxi
- 1.8%43Motorcycle
- 1.4%34Bicycle
- 4.8%116Walked
- 2.2%53Other means
- 26.5%634Worked at home

Time leaving home to go to work
![Time leaving home to go to work]()
- 4112:00 a.m. to 4:59 a.m.
- 615:00 a.m. to 5:29 a.m.
- 855:30 a.m. to 5:59 a.m.
- 1096:00 a.m. to 6:29 a.m.
- 1486:30 a.m. to 6:59 a.m.
- 2037:00 a.m. to 7:29 a.m.
- 2247:30 a.m. to 7:59 a.m.
- 6078:00 a.m. to 8:29 a.m.
- 2288:30 a.m. to 8:59 a.m.
- 2889:00 a.m. to 9:59 a.m.
- 14710:00 a.m. to 10:59 a.m.
- 3211:00 a.m. to 11:59 a.m.
- 12212:00 p.m. to 3:59 p.m.
- 1204:00 p.m. to 11:59 p.m.

Occupations of males:
- Percentage of males in management occupations (except farmers):
Here: 14.4% city: 22.2%
- Percentage of males in business and financial operations occupations:
Here: 7.5% city: 7.5%
- Percentage of males in computer and mathematical occupations:
Here: 23.9% city: 18.4%
- Percentage of males in architecture and engineering occupations:
Here: 9.9% city: 9.3%
- Percentage of males in life, physical, and social science occupations:
Here: 3.1% city: 5.0%
- Percentage of males in community and social services occupations:
Here: 2.2% city: 0.9%
- Percentage of males in education, training, and library occupations:
Here: 2.5% city: 3.7%
- Percentage of males in arts, design, entertainment, sports, and media occupations:
Here: 2.8% city: 2.3%
- Percentage of males in healthcare practitioners and technical occupations:
Here: 4.2% city: 2.8%
- Percentage of males in service occupations:
Here: 7.1% city: 8.1%
- Percentage of males in sales and office occupations:
Here: 7.5% city: 7.4%
- Percentage of males in construction, extraction, and maintenance occupations:
Here: 2.0% city: 2.8%
- Percentage of males in production occupations:
Here: 1.4% city: 1.1%
- Percentage of males in transportation occupations:
Here: 4.8% city: 1.5%
- Percentage of males in material moving occupations:
Here: 2.2% city: 2.7%
Occupations of females:
- Percentage of females in management occupations (except farmers):
Here: 16.8% city: 21.7%
- Percentage of females in business and financial operations occupations:
Here: 6.2% city: 10.5%
- Percentage of females in computer and mathematical occupations:
Here: 7.9% city: 5.8%
- Percentage of females in architecture and engineering occupations:
Here: 3.2% city: 3.3%
- Percentage of females in life, physical, and social science occupations:
Here: 3.4% city: 4.4%
- Percentage of females in legal occupations:
Here: 1.7% city: 1.3%
- Percentage of females in education, training, and library occupations:
Here: 3.9% city: 8.2%
- Percentage of females in arts, design, entertainment, sports, and media occupations:
Here: 10.7% city: 7.9%
- Percentage of females in healthcare practitioners and technical occupations:
Here: 6.8% city: 7.1%
- Percentage of females in service occupations:
Here: 10.4% city: 8.5%
- Percentage of females in sales and office occupations:
Here: 16.4% city: 17.0%
- Percentage of females in production occupations:
Here: 3.4% city: 1.6%
- Percentage of females in transportation occupations:
Here: 5.8% city: 1.0%
- Percentage of females in material moving occupations:
Here: 1.1% city: 0.2%
Education in this neighborhood (subdivision or community):
- Percentage of people 3 years and older in K-12 schools:
Sterling Downs: 17.6% Belmont: 17.9%
- Percentage of people 3 years and older in undergraduate colleges:
Sterling Downs: 4.4% Belmont: 5.0%
- Percentage of people 3 years and older in grad. or professional schools:
Sterling Downs: 6.1% Belmont: 1.3%
- Percentage of students K-12 enrolled in private schools:
Sterling Downs: 38.5% Belmont: 9.7%
Percentage of population below poverty level:
| Sterling Downs: | 10.5% |
| Belmont: | 6.9% |
Median year owner moved in (as recorded in 2022):
Median year renter moved in (as recorded in 2022):
| Sterling Downs: | 2000 |
| Belmont: | 2005 |
Median year renter moved in (as recorded in 2022):
| Sterling Downs: | 2017 |
| Belmont: | 2017 |
Percentage of married-couple families with both working:
| Sterling Downs: | 71.4% |
| Belmont: | 73.7% |

- 47.9%Utility gas
- 40.7%Electricity
- 5.6%Bottled, tank, or LP gas
- 2.5%No fuel used
- 1.9%Wood
- 0.8%Solar energy
- 0.7%Other fuel
Limited-access highways (interstate or state) in this neighborhood:
Bayshore Fwy (US Hwy 101)
Length: 0.88 miles
Direction: SE-NW
Direction: SE-NW
Highways in this neighborhood:
el Camino Real (State Hwy 82)
Length: 0.19 miles
Direction: SE-NW
Address range: 390 to 499
Direction: SE-NW
Address range: 390 to 499
Roads and streets:
Hiller St
Length: 1.08 miles
Directions: E-W, N-S, SE-NW
Address range: 100 to 999
Directions: E-W, N-S, SE-NW
Address range: 100 to 999
Old County Rd
Length: 0.97 miles
Direction: SE-NW
Address range: 100 to 999
Direction: SE-NW
Address range: 100 to 999
Ralston Ave
Length: 0.95 miles
Directions: E-W, N-S, SW-NE
Address range: 400 to 749
Directions: E-W, N-S, SW-NE
Address range: 400 to 749
Chesterton Ave
Length: 0.82 miles
Directions: E-W, SW-NE
Address range: 300 to 699
Directions: E-W, SW-NE
Address range: 300 to 699
Oxford Way
Length: 0.62 miles
Directions: E-W, N-S, SE-NW, SW-NE
Address range: 100 to 499
Directions: E-W, N-S, SE-NW, SW-NE
Address range: 100 to 499
Woodbridge Cir
Length: 0.61 miles
Directions: E-W, N-S, SE-NW, SW-NE
Address range: 100 to 299
Directions: E-W, N-S, SE-NW, SW-NE
Address range: 100 to 299
Rosilie St
Length: 0.57 miles
Directions: E-W, N-S, SW-NE
Address range: 100 to 799
Directions: E-W, N-S, SW-NE
Address range: 100 to 799
Marine View St
Length: 0.41 miles
Directions: N-S, SW-NE
Address range: 300 to 599
Directions: N-S, SW-NE
Address range: 300 to 599
US Hwy 101
Length: 0.37 miles
Direction: SE-NW
Direction: SE-NW
Cambridge St
Length: 0.32 miles
Directions: E-W, SE-NW, SW-NE
Address range: 500 to 599
Directions: E-W, SE-NW, SW-NE
Address range: 500 to 599
Wessex Way
Length: 0.30 miles
Directions: E-W, N-S, SW-NE
Address range: 400 to 699
Directions: E-W, N-S, SW-NE
Address range: 400 to 699
Vailwood Way
Length: 0.29 miles
Directions: E-W, N-S, SE-NW, SW-NE
Address range: 1100 to 1198
Directions: E-W, N-S, SE-NW, SW-NE
Address range: 1100 to 1198
Ramblewood Way
Length: 0.28 miles
Directions: E-W, N-S, SE-NW, SW-NE
Address range: 1100 to 1199
Directions: E-W, N-S, SE-NW, SW-NE
Address range: 1100 to 1199
Seagate Way
Length: 0.26 miles
Directions: E-W, N-S, SE-NW, SW-NE
Address range: 100 to 599
Directions: E-W, N-S, SE-NW, SW-NE
Address range: 100 to 599
Laurie Meadows Dr
Length: 0.26 miles
Direction: E-W
Direction: E-W
Pebblewood Way
Length: 0.25 miles
Directions: E-W, N-S, SE-NW, SW-NE
Address range: 1100 to 1199
Directions: E-W, N-S, SE-NW, SW-NE
Address range: 1100 to 1199
Masonic Way
Length: 0.24 miles
Direction: SW-NE
Address range: 500 to 699
Direction: SW-NE
Address range: 500 to 699
Tanglewood Way
Length: 0.23 miles
Directions: E-W, N-S, SE-NW, SW-NE
Address range: 1100 to 1198
Directions: E-W, N-S, SE-NW, SW-NE
Address range: 1100 to 1198
Mountain View Ave
Length: 0.23 miles
Directions: N-S, SW-NE
Address range: 300 to 699
Directions: N-S, SW-NE
Address range: 300 to 699
Island Pkwy
Length: 0.21 miles
Directions: E-W, N-S, SE-NW
Address range: 500 to 799
Directions: E-W, N-S, SE-NW
Address range: 500 to 799
Yorkshire Way
Length: 0.17 miles
Directions: E-W, SE-NW
Address range: 400 to 499
Directions: E-W, SE-NW
Address range: 400 to 499
Granada St
Length: 0.15 miles
Direction: SE-NW
Address range: 800 to 999
Direction: SE-NW
Address range: 800 to 999
Roxbury Way
Length: 0.15 miles
Directions: N-S, SW-NE
Address range: 500 to 599
Directions: N-S, SW-NE
Address range: 500 to 599
Dale View Ave
Length: 0.14 miles
Directions: N-S, SW-NE
Address range: 400 to 599
Directions: N-S, SW-NE
Address range: 400 to 599
Middlesex Rd
Length: 0.13 miles
Direction: SW-NE
Address range: 500 to 599
Direction: SW-NE
Address range: 500 to 599
Vailwood Pl
Length: 0.12 miles
Directions: E-W, SE-NW
Address range: 100 to 155
Directions: E-W, SE-NW
Address range: 100 to 155
Cornish Way
Length: 0.12 miles
Directions: N-S, SW-NE
Address range: 400 to 499
Directions: N-S, SW-NE
Address range: 400 to 499
Crest View Ave
Length: 0.10 miles
Direction: SW-NE
Address range: 500 to 699
Direction: SW-NE
Address range: 500 to 699
Sterling View St
Length: 0.10 miles
Direction: SW-NE
Address range: 500 to 599
Direction: SW-NE
Address range: 500 to 599
Briarfield Way
Length: 0.10 miles
Direction: SW-NE
Address range: 400 to 499
Direction: SW-NE
Address range: 400 to 499
Seagate Dr
Length: 0.09 miles
Directions: E-W, SE-NW
Address range: 100 to 199
Directions: E-W, SE-NW
Address range: 100 to 199
Briarwood Way
Length: 0.09 miles
Directions: N-S, SW-NE
Address range: 1 to 32
Directions: N-S, SW-NE
Address range: 1 to 32
Suzie St
Length: 0.08 miles
Direction: N-S
Address range: 100 to 4199
Direction: N-S
Address range: 100 to 4199
Margaret Ct
Length: 0.07 miles
Direction: N-S
Address range: 4100 to 4199
Direction: N-S
Address range: 4100 to 4199
Biddulph Way
Length: 0.03 miles
Direction: SW-NE
Address range: 500 to 721
Direction: SW-NE
Address range: 500 to 721
Sussex Ct
Length: 0.03 miles
Directions: N-S, SW-NE
Address range: 300 to 399
Directions: N-S, SW-NE
Address range: 300 to 399
Seagate Pl
Length: 0.02 miles
Direction: SW-NE
Address range: 1 to 16
Direction: SW-NE
Address range: 1 to 16