Starlight Hills neighborhood in Burbank, California (CA), 91501, 91504 detailed profile
Settings
X


Business Search - 14 Million verified businesses
Area: 0.430 square miles
Population: 1,766
Population density:
| Starlight Hills: | 4,111 people per square mile |
| Burbank: | 5,990 people per square mile |

- 1,11156.1%White
- 30815.6%Asian
- 27413.8%Hispanic or Latino
- 1366.9%Two or more races
- 673.4%American Indian
- 613.1%Black
- 231.2%Some other race

Median household income in 2022:
| Starlight Hills: | $160,306 |
| Burbank: | $92,581 |
Distribution of median household income
![Distribution of median household income]()
- 308Less than $10,000
- 22$10,000 to $19,999
- 134$20,000 to $29,999
- 44$30,000 to $39,999
- 28$40,000 to $49,999
- 35$50,000 to $59,999
- 43$60,000 to $74,999
- 104$75,000 to $99,999
- 17$100,000 to $124,999
- 41$125,000 to $149,999
- 56$150,000 to $199,999
- 278$200,000 or more

Distribution of owner-occupied house/condo value
![Distribution of owner-occupied house/condo value]()
- 18Less than $50,000
- 14$50,000 to $99,999
- 80$100,000 to $149,999
- 29$150,000 to $199,999
- 39$250,000 to $299,999
- 28$300,000 to $399,999
- 41$400,000 to $499,999
- 17$500,000 to $749,999
- 206$750,000 to $999,999
- 326$1,000,000 or more

Distribution of rent paid by renters
![Distribution of rent paid by renters]()
- 19$800 to $899
- 3$900 to $999
- 63$1,000 to $1,249
- 102$1,250 to $1,499
- 123$1,500 to $1,999
- 273$2,000 or more

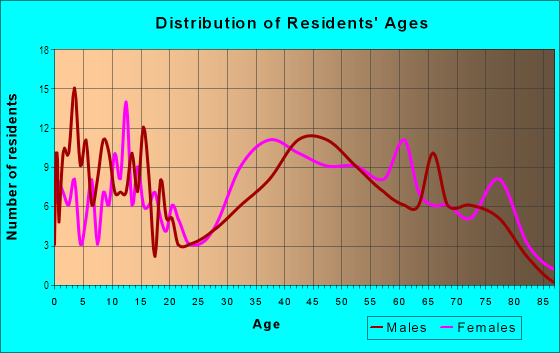
| Males: | 753 |
| Females: | 1,012 |
Males:
| This neighborhood: | 46.3 years |
| Whole city: | 36.7 years |
| This neighborhood: | 46.5 years |
| Whole city: | 42.1 years |
Average household size:
| Starlight Hills: | 2.8 people |
| Burbank: | 2.4 people |
Percentage of family households:
| Starlight Hills: | 45.3% |
| Burbank: | 43.5% |
| Here: | 74.7% |
| Burbank: | 40.3% |
Percentage of married-couple families with children (among all households):
| Starlight Hills: | 32.8% |
| Burbank: | 32.8% |
Percentage of single-mother households (among all households):
| Starlight Hills: | 1.3% |
| Burbank: | 7.0% |
Percentage of never married males 15 years old and over:
Percentage of never married females 15 years old and over:
| Starlight Hills: | 5.8% |
| Burbank: | 20.3% |
Percentage of never married females 15 years old and over:
| Starlight Hills: | 14.5% |
| city: | 18.6% |
Percentage of people that speak English not well or not at all:
| Starlight Hills: | 3.5% |
| Burbank: | 5.9% |
Percentage of people born in this state:
Percentage of people born in another U.S. state:
Percentage of native residents but born outside the U.S.:
Percentage of foreign born residents:
| Here: | 48.5% |
| Burbank: | 50.1% |
Percentage of people born in another U.S. state:
| Starlight Hills: | 18.5% |
| Burbank: | 21.2% |
Percentage of native residents but born outside the U.S.:
| Here: | 1.9% |
| city: | 1.2% |
Percentage of foreign born residents:
| Here: | 31.0% |
| Burbank: | 27.4% |

Owner-occupied
Renter-occupied


- Rooms in owner-occupied houses and condos in Starlight Hills
- 01 room
- 02 rooms
- 573 rooms
- 74 rooms
- 1355 rooms
- 1476 rooms
- 717 rooms
- 1078 rooms
- 829+ rooms
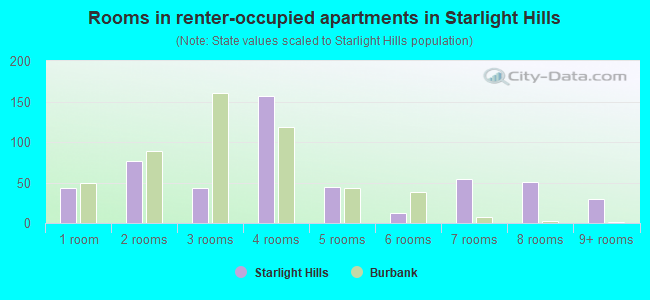
- Rooms in renter-occupied apartments in Starlight Hills
- 431 room
- 762 rooms
- 433 rooms
- 1574 rooms
- 445 rooms
- 126 rooms
- 547 rooms
- 518 rooms
- 309+ rooms
Owner-occupied
Renter-occupied

- Bedrooms in owner-occupied houses and condos in Starlight Hills
- 0no bedroom
- 01 bedroom
- 282 bedrooms
- 2683 bedrooms
- 1764 bedrooms
- 865+ bedrooms

- Bedrooms in renter-occupied apartments in Starlight Hills
- 43no bedroom
- 1641 bedroom
- 492 bedrooms
- 53 bedrooms
- 354 bedrooms
- 05+ bedrooms
Average number of cars or other vehicles available in houses/condos:
Average number of cars or other vehicles available in apartments:
| This neighborhood: | 0.3 |
| Burbank: | 2.1 |
Average number of cars or other vehicles available in apartments:
| Here: | |
| city: |
Percentage of units with a mortgage:
| Starlight Hills: | 81.5% |
| Burbank: | 73.7% |
Average estimated value of detached houses in 2022 (98.0% of all units):
| Starlight Hills: | $1,274,761 |
| Burbank: | $1,253,446 |

- Year house built in Starlight Hills
- 02020 or later
- 202010 to 2019
- 872000 to 2009
- 11990 to 1999
- 301980 to 1989
- 731970 to 1979
- 1171960 to 1969
- 3731950 to 1959
- 831940 to 1949
- 241939 or earlier

City-data.com crime index for city in 2020 (higher means more crime):
| City: | 164.4 |
| U.S. average: | 219.5 |
Travel time to work (commute)
![Travel time to work (commute)]()
- 2Less than 5 minutes
- 105 to 9 minutes
- 5510 to 14 minutes
- 8515 to 19 minutes
- 10920 to 24 minutes
- 2425 to 29 minutes
- 7530 to 34 minutes
- 2235 to 39 minutes
- 2340 to 44 minutes
- 12245 to 59 minutes
- 6560 to 89 minutes
- 290 or more minutes

Means of transportation to work
![Means of transportation to work]()
- 60.8%524Drove a car alone
- 3.1%27Carpooled
- 51.0%439Bus
- 2.9%25Long-distance train or commuter rail
- 1.3%11Bicycle
- 47.8%412Walked
- 0.2%2Other means
- 23.5%202Worked at home

Time leaving home to go to work
![Time leaving home to go to work]()
- 4712:00 a.m. to 4:59 a.m.
- 115:00 a.m. to 5:29 a.m.
- 235:30 a.m. to 5:59 a.m.
- 436:00 a.m. to 6:29 a.m.
- 186:30 a.m. to 6:59 a.m.
- 547:00 a.m. to 7:29 a.m.
- 917:30 a.m. to 7:59 a.m.
- 1378:00 a.m. to 8:29 a.m.
- 838:30 a.m. to 8:59 a.m.
- 479:00 a.m. to 9:59 a.m.
- 2010:00 a.m. to 10:59 a.m.
- 16911:00 a.m. to 11:59 a.m.
- 1312:00 p.m. to 3:59 p.m.
- 314:00 p.m. to 11:59 p.m.

Occupations of males:
- Percentage of males in management occupations (except farmers):
Here: 44.2% city: 12.9%
- Percentage of males in business and financial operations occupations:
Here: 5.4% city: 6.1%
- Percentage of males in architecture and engineering occupations:
Here: 4.0% city: 3.3%
- Percentage of males in legal occupations:
Here: 15.1% city: 1.7%
- Percentage of males in arts, design, entertainment, sports, and media occupations:
Here: 1.5% city: 18.9%
- Percentage of males in healthcare practitioners and technical occupations:
Here: 2.9% city: 3.0%
- Percentage of males in service occupations:
Here: 5.7% city: 11.2%
- Percentage of males in sales and office occupations:
Here: 16.5% city: 14.1%
- Percentage of males in production occupations:
Here: 1.3% city: 4.8%
- Percentage of males in transportation occupations:
Here: 2.4% city: 4.5%
Occupations of females:
- Percentage of females in management occupations (except farmers):
Here: 6.6% city: 13.3%
- Percentage of females in business and financial operations occupations:
Here: 18.7% city: 8.3%
- Percentage of females in computer and mathematical occupations:
Here: 3.5% city: 1.8%
- Percentage of females in life, physical, and social science occupations:
Here: 1.4% city: 1.1%
- Percentage of females in community and social services occupations:
Here: 1.5% city: 2.2%
- Percentage of females in education, training, and library occupations:
Here: 33.3% city: 7.5%
- Percentage of females in arts, design, entertainment, sports, and media occupations:
Here: 6.8% city: 11.3%
- Percentage of females in healthcare practitioners and technical occupations:
Here: 14.3% city: 7.1%
- Percentage of females in service occupations:
Here: 3.7% city: 17.4%
- Percentage of females in sales and office occupations:
Here: 8.6% city: 24.6%
- Percentage of females in production occupations:
Here: 1.4% city: 1.7%
Education in this neighborhood (subdivision or community):
- Percentage of people 3 years and older in K-12 schools:
Starlight Hills: 37.5% Burbank: 13.3%
- Percentage of people 3 years and older in undergraduate colleges:
Starlight Hills: 10.9% Burbank: 5.8%
- Percentage of people 3 years and older in grad. or professional schools:
Starlight Hills: 16.7% Burbank: 2.1%
- Percentage of students K-12 enrolled in private schools:
Starlight Hills: 22.1% Burbank: 10.0%
Percentage of population below poverty level:
| Starlight Hills: | 11.7% |
| Burbank: | 9.5% |
Median year owner moved in (as recorded in 2022):
| Starlight Hills: | 2003 |
| Burbank: | 2005 |
Percentage of married-couple families with both working:
| Starlight Hills: | 82.6% |
| Burbank: | 68.2% |

- 80.5%Utility gas
- 10.9%Electricity
- 3.7%Wood
- 2.5%Bottled, tank, or LP gas
- 1.2%Solar energy
- 1.2%No fuel used
Roads and streets:
N Lamer St
Length: 0.90 miles
Directions: E-W, N-S, SE-NW, SW-NE
Address range: 2600 to 3299
Directions: E-W, N-S, SE-NW, SW-NE
Address range: 2600 to 3299
Scott Rd
Length: 0.60 miles
Directions: E-W, N-S, SE-NW
Address range: 3000 to 3801
Directions: E-W, N-S, SE-NW
Address range: 3000 to 3801
N Keystone St
Length: 0.55 miles
Directions: E-W, N-S, SW-NE
Address range: 2700 to 3099
Directions: E-W, N-S, SW-NE
Address range: 2700 to 3099
N Kenneth Rd
Length: 0.52 miles
Direction: E-W
Address range: 2800 to 3210
Direction: E-W
Address range: 2800 to 3210
N Myers St
Length: 0.25 miles
Direction: N-S
Address range: 2800 to 2999
Direction: N-S
Address range: 2800 to 2999
N Lincoln St
Length: 0.25 miles
Direction: N-S
Address range: 2800 to 2999
Direction: N-S
Address range: 2800 to 2999
N Brighton St
Length: 0.25 miles
Direction: N-S
Address range: 2800 to 2999
Direction: N-S
Address range: 2800 to 2999
N Parish Pl
Length: 0.20 miles
Directions: N-S, SE-NW
Address range: 2600 to 2799
Directions: N-S, SE-NW
Address range: 2600 to 2799
Mesa Verde Dr
Length: 0.16 miles
Direction: E-W
Address range: 3000 to 3199
Direction: E-W
Address range: 3000 to 3199
Jolley Dr
Length: 0.13 miles
Directions: E-W, SE-NW
Address range: 3100 to 3199
Directions: E-W, SE-NW
Address range: 3100 to 3199
Adornos Way
Length: 0.13 miles
Directions: N-S, SW-NE
Address range: 3000 to 3099
Directions: N-S, SW-NE
Address range: 3000 to 3099
Trudi Ln
Length: 0.13 miles
Directions: E-W, N-S, SE-NW, SW-NE
Address range: 3000 to 3099
Directions: E-W, N-S, SE-NW, SW-NE
Address range: 3000 to 3099
Haven Way
Length: 0.11 miles
Directions: E-W, SW-NE
Address range: 2600 to 2799
Directions: E-W, SW-NE
Address range: 2600 to 2799
Highland View Dr
Length: 0.11 miles
Direction: E-W
Address range: 3100 to 3199
Direction: E-W
Address range: 3100 to 3199
Crest Ridge Dr
Length: 0.04 miles
Directions: N-S, SE-NW
Address range: 2900 to 2999
Directions: N-S, SE-NW
Address range: 2900 to 2999
Harold Cir
Length: 0.04 miles
Direction: E-W
Direction: E-W
Whitney Ln
Length: 0.04 miles
Direction: SW-NE
Address range: 3200 to 3299
Direction: SW-NE
Address range: 3200 to 3299
Purvis Dr
Length: 0.03 miles
Direction: N-S
Address range: 2500 to 2599
Direction: N-S
Address range: 2500 to 2599