Stanley neighborhood in Napa, California (CA), 94559 detailed profile
Settings
X


Business Search - 14 Million verified businesses
Area: 2.322 square miles
Population: 2,356
Population density:
| Stanley: | 1,015 people per square mile |
| Napa: | 4,425 people per square mile |

- 1,22649.9%White
- 1,02441.7%Hispanic or Latino
- 1034.2%Some other race
- 522.1%Asian
- 471.9%Two or more races
- 40.2%Black

Median household income in 2022:
| Stanley: | $96,028 |
| Napa: | $94,248 |
Distribution of median household income
![Distribution of median household income]()
- 10Less than $10,000
- 29$30,000 to $39,999
- 206$40,000 to $49,999
- 123$50,000 to $59,999
- 61$60,000 to $74,999
- 51$75,000 to $99,999
- 111$100,000 to $124,999
- 69$125,000 to $149,999
- 143$150,000 to $199,999
- 130$200,000 or more

Distribution of owner-occupied house/condo value
![Distribution of owner-occupied house/condo value]()
- 21Less than $50,000
- 13$50,000 to $99,999
- 11$300,000 to $399,999
- 18$400,000 to $499,999
- 170$500,000 to $749,999
- 21$750,000 to $999,999
- 144$1,000,000 or more

Distribution of rent paid by renters
![Distribution of rent paid by renters]()
- 17$700 to $799
- 90$1,000 to $1,249
- 43$1,250 to $1,499
- 177$1,500 to $1,999
- 179$2,000 or more

Median rent in 2022:
| Stanley: | $1,795 |
| Napa: | $1,913 |
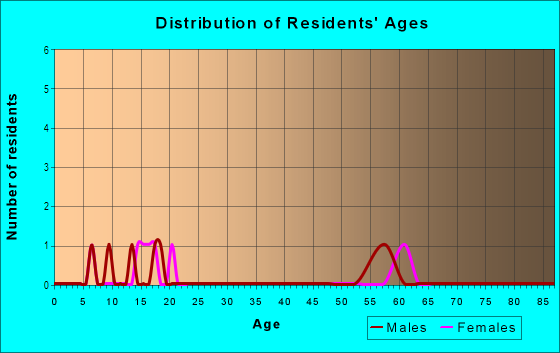
| Males: | 1,110 |
| Females: | 1,246 |
Males:
| This neighborhood: | 37.2 years |
| Whole city: | 41.0 years |
| This neighborhood: | 45.3 years |
| Whole city: | 41.5 years |
Average household size:
| Stanley: | 2.7 people |
| Napa: | 2.5 people |
Percentage of family households:
| Stanley: | 46.1% |
| Napa: | 46.8% |
| Here: | 42.1% |
| Napa: | 46.9% |
Percentage of married-couple families with children (among all households):
| Stanley: | 26.4% |
| Napa: | 30.7% |
Percentage of single-mother households (among all households):
| Stanley: | 10.1% |
| Napa: | 6.0% |
Percentage of never married males 15 years old and over:
Percentage of never married females 15 years old and over:
| Stanley: | 18.5% |
| Napa: | 20.7% |
Percentage of never married females 15 years old and over:
| Stanley: | 13.0% |
| city: | 14.7% |
Percentage of people that speak English not well or not at all:
| Stanley: | 12.8% |
| Napa: | 8.8% |
Percentage of people born in this state:
Percentage of people born in another U.S. state:
Percentage of native residents but born outside the U.S.:
Percentage of foreign born residents:
| Here: | 62.4% |
| Napa: | 61.4% |
Percentage of people born in another U.S. state:
| Stanley: | 19.3% |
| Napa: | 16.1% |
Percentage of native residents but born outside the U.S.:
| Here: | 0.5% |
| city: | 1.0% |
Percentage of foreign born residents:
| Here: | 17.9% |
| Napa: | 21.5% |

Owner-occupied
Renter-occupied


- Rooms in owner-occupied houses and condos in Stanley
- 01 room
- 02 rooms
- 223 rooms
- 394 rooms
- 1555 rooms
- 416 rooms
- 347 rooms
- 388 rooms
- 259+ rooms

- Rooms in renter-occupied apartments in Stanley
- 111 room
- 802 rooms
- 1113 rooms
- 834 rooms
- 1235 rooms
- 546 rooms
- 07 rooms
- 378 rooms
- 09+ rooms
Owner-occupied
Renter-occupied

- Bedrooms in owner-occupied houses and condos in Stanley
- 0no bedroom
- 101 bedroom
- 122 bedrooms
- 2933 bedrooms
- 354 bedrooms
- 35+ bedrooms

- Bedrooms in renter-occupied apartments in Stanley
- 11no bedroom
- 1441 bedroom
- 1982 bedrooms
- 1283 bedrooms
- 174 bedrooms
- 05+ bedrooms
Average number of cars or other vehicles available in houses/condos:
Average number of cars or other vehicles available in apartments:
| This neighborhood: | 2.4 |
| Napa: | 2.2 |
Average number of cars or other vehicles available in apartments:
| Here: | 1.4 |
| city: | 1.8 |
Percentage of units with a mortgage:
| Stanley: | 64.7% |
| Napa: | 67.0% |

- Year house built in Stanley
- 02020 or later
- 702010 to 2019
- 792000 to 2009
- 1891990 to 1999
- 1191980 to 1989
- 3321970 to 1979
- 401960 to 1969
- 1001950 to 1959
- 171940 to 1949
- 181939 or earlier

City-data.com crime index for city in 2020 (higher means more crime):
| City: | 193.0 |
| U.S. average: | 219.5 |
Travel time to work (commute)
![Travel time to work (commute)]()
- 7Less than 5 minutes
- 1285 to 9 minutes
- 24510 to 14 minutes
- 25015 to 19 minutes
- 4020 to 24 minutes
- 6025 to 29 minutes
- 12730 to 34 minutes
- 1535 to 39 minutes
- 2640 to 44 minutes
- 7645 to 59 minutes
- 6060 to 89 minutes
- 790 or more minutes

Means of transportation to work
![Means of transportation to work]()
- 79.7%801Drove a car alone
- 3.3%33Carpooled
- 1.2%12Ferryboat
- 1.7%17Motorcycle
- 2.1%21Walked
- 13.6%137Worked at home

Time leaving home to go to work
![Time leaving home to go to work]()
- 6812:00 a.m. to 4:59 a.m.
- 585:00 a.m. to 5:29 a.m.
- 65:30 a.m. to 5:59 a.m.
- 786:00 a.m. to 6:29 a.m.
- 516:30 a.m. to 6:59 a.m.
- 977:00 a.m. to 7:29 a.m.
- 1087:30 a.m. to 7:59 a.m.
- 1908:00 a.m. to 8:29 a.m.
- 608:30 a.m. to 8:59 a.m.
- 599:00 a.m. to 9:59 a.m.
- 10310:00 a.m. to 10:59 a.m.
- 2211:00 a.m. to 11:59 a.m.
- 4312:00 p.m. to 3:59 p.m.
- 744:00 p.m. to 11:59 p.m.

Occupations of males:
- Percentage of males in management occupations (except farmers):
Here: 8.7% city: 14.5%
- Percentage of males in business and financial operations occupations:
Here: 1.2% city: 4.1%
- Percentage of males in education, training, and library occupations:
Here: 4.1% city: 4.0%
- Percentage of males in arts, design, entertainment, sports, and media occupations:
Here: 2.0% city: 1.6%
- Percentage of males in healthcare practitioners and technical occupations:
Here: 2.4% city: 1.9%
- Percentage of males in service occupations:
Here: 25.8% city: 18.1%
- Percentage of males in sales and office occupations:
Here: 11.6% city: 12.9%
- Percentage of males in farming, fishing, and forestry occupations:
Here: 2.5% city: 5.3%
- Percentage of males in construction, extraction, and maintenance occupations:
Here: 16.3% city: 8.4%
- Percentage of males in production occupations:
Here: 13.8% city: 8.6%
- Percentage of males in transportation occupations:
Here: 3.4% city: 4.5%
Occupations of females:
- Percentage of females in management occupations (except farmers):
Here: 8.4% city: 12.6%
- Percentage of females in business and financial operations occupations:
Here: 8.7% city: 6.6%
- Percentage of females in computer and mathematical occupations:
Here: 1.0% city: 1.1%
- Percentage of females in community and social services occupations:
Here: 4.3% city: 2.2%
- Percentage of females in education, training, and library occupations:
Here: 9.5% city: 7.3%
- Percentage of females in healthcare practitioners and technical occupations:
Here: 4.4% city: 8.5%
- Percentage of females in service occupations:
Here: 18.8% city: 23.7%
- Percentage of females in sales and office occupations:
Here: 34.1% city: 25.5%
- Percentage of females in farming, fishing, and forestry occupations:
Here: 10.7% city: 2.5%
Education in this neighborhood (subdivision or community):
- Percentage of people 3 years and older in K-12 schools:
Stanley: 18.5% Napa: 14.8%
- Percentage of people 3 years and older in undergraduate colleges:
Stanley: 3.4% Napa: 4.5%
- Percentage of people 3 years and older in grad. or professional schools:
Stanley: 0.3% Napa: 1.2%
- Percentage of students K-12 enrolled in private schools:
Stanley: 10.7% Napa: 17.2%
Percentage of population below poverty level:
| Stanley: | 3.7% |
| Napa: | 9.1% |
Median year owner moved in (as recorded in 2022):
Median year renter moved in (as recorded in 2022):
| Stanley: | 2012 |
| Napa: | 2010 |
Median year renter moved in (as recorded in 2022):
| Stanley: | 2015 |
| Napa: | 2018 |
Percentage of married-couple families with both working:
| Stanley: | 60.7% |
| Napa: | 71.9% |

- 76.2%Utility gas
- 22.1%Electricity
- 1.7%Bottled, tank, or LP gas
Highways in this neighborhood:
State Hwy 29 (State Hwy 12)
Length: 2.93 miles
Directions: E-W, N-S, SE-NW, SW-NE
Directions: E-W, N-S, SE-NW, SW-NE
State Hwy 121 (Carneros Hwy, Sonoma Hwy, State Hwy 12)
Length: 0.56 miles
Direction: E-W
Address range: 3100 to 3113
Direction: E-W
Address range: 3100 to 3113
State Hwy 29 (State Hwy 121, S Napa-Vallejo Hwy)
Length: 0.03 miles
Direction: SW-NE
Direction: SW-NE
Roads and streets:
Stanley Ln
Length: 1.80 miles
Directions: E-W, N-S, SE-NW, SW-NE
Address range: 1224 to 1499
Directions: E-W, N-S, SE-NW, SW-NE
Address range: 1224 to 1499
Cuttings Wharf Rd
Length: 0.69 miles
Directions: SE-NW, SW-NE
Directions: SE-NW, SW-NE