Springbrook neighborhood in Silver Spring, Maryland (MD), 20904 detailed profile
Settings
X


Business Search - 14 Million verified businesses
Area: 0.837 square miles
Population: 2,592
Population density:
| Springbrook: | 3,098 people per square mile |
| Silver Spring: | 7,993 people per square mile |

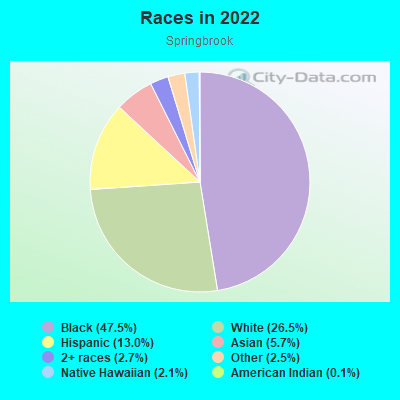
- 1,26947.5%Black
- 70926.5%White
- 34713.0%Hispanic or Latino
- 1535.7%Asian
- 712.7%Two or more races
- 662.5%Some other race
- 552.1%Native Hawaiian and Other
Pacific Islander - 40.1%American Indian
Median household income in 2022:
| Springbrook: | $155,873 |
| Silver Spring: | $81,557 |
Distribution of median household income
![Distribution of median household income]()
- 34Less than $10,000
- 26$10,000 to $19,999
- 51$20,000 to $29,999
- 118$30,000 to $39,999
- 77$40,000 to $49,999
- 18$50,000 to $59,999
- 88$60,000 to $74,999
- 80$75,000 to $99,999
- 183$100,000 to $124,999
- 36$125,000 to $149,999
- 97$150,000 to $199,999
- 312$200,000 or more

Distribution of owner-occupied house/condo value
![Distribution of owner-occupied house/condo value]()
- 19Less than $50,000
- 16$50,000 to $99,999
- 29$100,000 to $149,999
- 24$150,000 to $199,999
- 24$250,000 to $299,999
- 151$300,000 to $399,999
- 269$400,000 to $499,999
- 322$500,000 to $749,999
- 45$750,000 to $999,999
- 33$1,000,000 or more

Distribution of rent paid by renters
![Distribution of rent paid by renters]()
- 10$200 to $299
- 29$600 to $699
- 19$1,000 to $1,249
- 20$1,250 to $1,499
- 30$1,500 to $1,999
- 183$2,000 or more

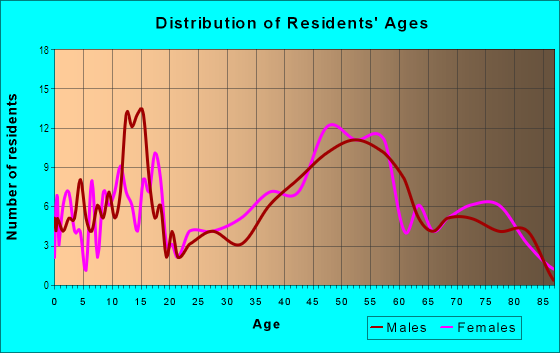
| Males: | 1,259 |
| Females: | 1,332 |
Males:
| This neighborhood: | 47.6 years |
| Whole city: | 36.7 years |
| This neighborhood: | 51.2 years |
| Whole city: | 36.5 years |
Average household size:
| Springbrook: | 10.4 people |
| Silver Spring: | 2.2 people |
Percentage of family households:
| Springbrook: | 57.6% |
| Silver Spring: | 38.8% |
| Here: | 61.7% |
| Silver Spring: | 32.5% |
Percentage of married-couple families with children (among all households):
| Springbrook: | 26.8% |
| Silver Spring: | 34.5% |
Percentage of single-mother households (among all households):
| Springbrook: | 9.1% |
| Silver Spring: | 6.6% |
Percentage of never married males 15 years old and over:
Percentage of never married females 15 years old and over:
| Springbrook: | 15.8% |
| Silver Spring: | 22.2% |
Percentage of never married females 15 years old and over:
| Springbrook: | 20.3% |
| place: | 24.3% |
Percentage of people that speak English not well or not at all:
| Springbrook: | 10.1% |
| Silver Spring: | 9.9% |
Percentage of people born in this state:
Percentage of people born in another U.S. state:
Percentage of native residents but born outside the U.S.:
Percentage of foreign born residents:
| Here: | 21.9% |
| Silver Spring: | 19.7% |
Percentage of people born in another U.S. state:
| Springbrook: | 46.2% |
| Silver Spring: | 45.9% |
Percentage of native residents but born outside the U.S.:
| Here: | 1.0% |
| place: | 2.4% |
Percentage of foreign born residents:
| Here: | 31.0% |
| Silver Spring: | 32.0% |
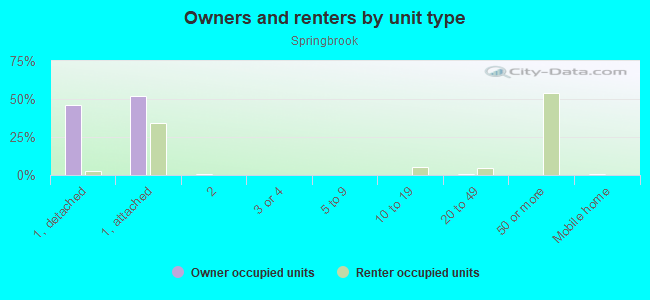
Owner-occupied
Renter-occupied

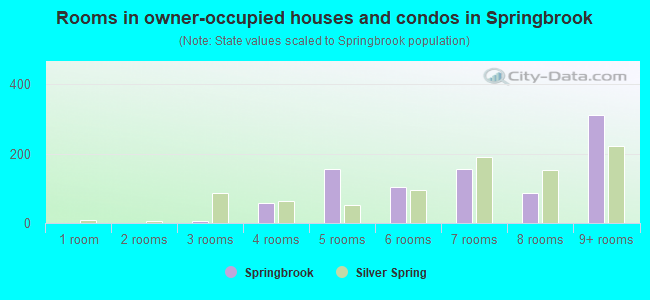
- Rooms in owner-occupied houses and condos in Springbrook
- 01 room
- 02 rooms
- 63 rooms
- 594 rooms
- 1565 rooms
- 1036 rooms
- 1567 rooms
- 858 rooms
- 3119+ rooms

- Rooms in renter-occupied apartments in Springbrook
- 2711 room
- 282 rooms
- 93 rooms
- 244 rooms
- 275 rooms
- 1146 rooms
- 557 rooms
- 128 rooms
- 399+ rooms
Owner-occupied
Renter-occupied
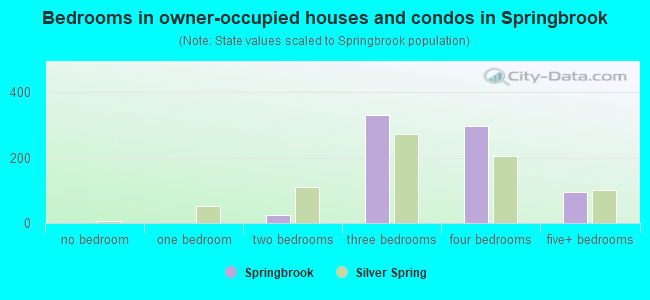
- Bedrooms in owner-occupied houses and condos in Springbrook
- 0no bedroom
- 01 bedroom
- 252 bedrooms
- 3303 bedrooms
- 2974 bedrooms
- 945+ bedrooms
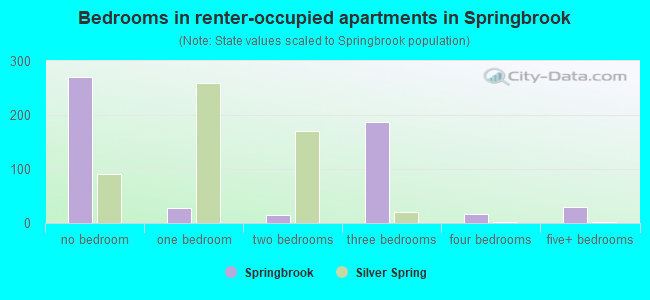
- Bedrooms in renter-occupied apartments in Springbrook
- 271no bedroom
- 281 bedroom
- 142 bedrooms
- 1873 bedrooms
- 164 bedrooms
- 305+ bedrooms
Average number of cars or other vehicles available in houses/condos:
Average number of cars or other vehicles available in apartments:
| This neighborhood: | 2.1 |
| Silver Spring: | 1.7 |
Average number of cars or other vehicles available in apartments:
| Here: | |
| place: |
Percentage of units with a mortgage:
| Springbrook: | 73.1% |
| Silver Spring: | 76.3% |
Average estimated value of detached houses in 2022 (53.9% of all units):
| Springbrook: | $619,433 |
| Maryland: | $526,819 |
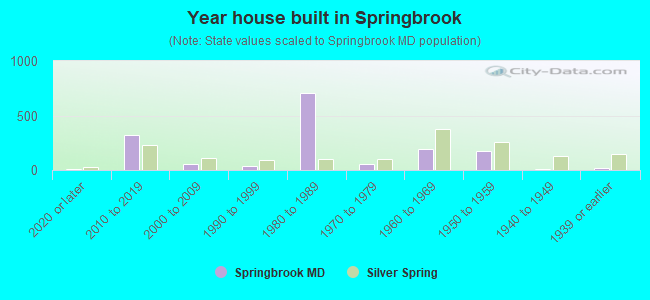
- Year house built in Springbrook
- 62020 or later
- 3242010 to 2019
- 522000 to 2009
- 351990 to 1999
- 7071980 to 1989
- 511970 to 1979
- 1951960 to 1969
- 1701950 to 1959
- 91940 to 1949
- 161939 or earlier
Travel time to work (commute)
![Travel time to work (commute)]()
- 9Less than 5 minutes
- 535 to 9 minutes
- 4710 to 14 minutes
- 3515 to 19 minutes
- 7920 to 24 minutes
- 9825 to 29 minutes
- 15930 to 34 minutes
- 3735 to 39 minutes
- 7240 to 44 minutes
- 18945 to 59 minutes
- 13160 to 89 minutes
- 3290 or more minutes

Means of transportation to work
![Means of transportation to work]()
- 54.1%720Drove a car alone
- 13.2%176Carpooled
- 1.3%17Bus
- 5.5%73Subway or elevated rail
- 1.4%19Long-distance train or commuter rail
- 9.2%122Taxi
- 1.4%19Bicycle
- 1.4%19Walked
- 5.6%74Other means
- 19.2%256Worked at home

Time leaving home to go to work
![Time leaving home to go to work]()
- 112:00 a.m. to 4:59 a.m.
- 195:00 a.m. to 5:29 a.m.
- 215:30 a.m. to 5:59 a.m.
- 946:00 a.m. to 6:29 a.m.
- 546:30 a.m. to 6:59 a.m.
- 2197:00 a.m. to 7:29 a.m.
- 647:30 a.m. to 7:59 a.m.
- 1608:00 a.m. to 8:29 a.m.
- 898:30 a.m. to 8:59 a.m.
- 839:00 a.m. to 9:59 a.m.
- 610:00 a.m. to 10:59 a.m.
- 2011:00 a.m. to 11:59 a.m.
- 4112:00 p.m. to 3:59 p.m.
- 584:00 p.m. to 11:59 p.m.

Occupations of males:
- Percentage of males in management occupations (except farmers):
Here: 15.7% place: 11.4%
- Percentage of males in business and financial operations occupations:
Here: 5.9% place: 6.8%
- Percentage of males in computer and mathematical occupations:
Here: 16.2% place: 9.4%
- Percentage of males in architecture and engineering occupations:
Here: 4.7% place: 4.5%
- Percentage of males in life, physical, and social science occupations:
Here: 3.0% place: 5.3%
- Percentage of males in legal occupations:
Here: 3.6% place: 3.6%
- Percentage of males in education, training, and library occupations:
Here: 3.2% place: 6.2%
- Percentage of males in arts, design, entertainment, sports, and media occupations:
Here: 3.2% place: 3.9%
- Percentage of males in healthcare practitioners and technical occupations:
Here: 9.0% place: 2.5%
- Percentage of males in service occupations:
Here: 11.1% place: 10.9%
- Percentage of males in sales and office occupations:
Here: 11.2% place: 9.6%
- Percentage of males in construction, extraction, and maintenance occupations:
Here: 2.7% place: 11.6%
- Percentage of males in production occupations:
Here: 1.6% place: 2.2%
- Percentage of males in transportation occupations:
Here: 5.7% place: 6.4%
Occupations of females:
- Percentage of females in management occupations (except farmers):
Here: 6.9% place: 13.0%
- Percentage of females in business and financial operations occupations:
Here: 11.6% place: 8.9%
- Percentage of females in computer and mathematical occupations:
Here: 9.0% place: 5.0%
- Percentage of females in life, physical, and social science occupations:
Here: 4.4% place: 3.4%
- Percentage of females in community and social services occupations:
Here: 6.9% place: 2.9%
- Percentage of females in legal occupations:
Here: 3.2% place: 4.2%
- Percentage of females in education, training, and library occupations:
Here: 6.2% place: 11.2%
- Percentage of females in arts, design, entertainment, sports, and media occupations:
Here: 2.9% place: 4.5%
- Percentage of females in healthcare practitioners and technical occupations:
Here: 11.4% place: 5.3%
- Percentage of females in service occupations:
Here: 15.3% place: 20.4%
- Percentage of females in sales and office occupations:
Here: 12.6% place: 16.7%
- Percentage of females in transportation occupations:
Here: 1.9% place: 0.6%
- Percentage of females in material moving occupations:
Here: 6.0% place: 1.3%
Percentage of people 16-64 in Armed Forces:
| Springbrook: | 0.0% |
| Silver Spring: | 0.4% |
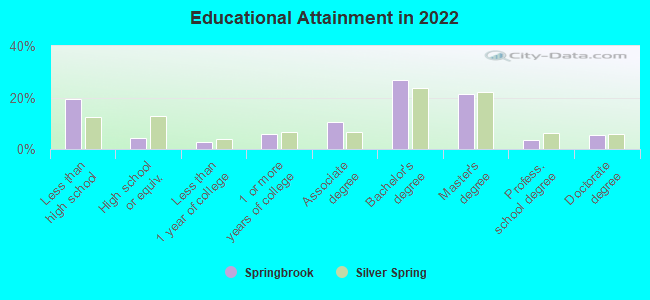
Education in this neighborhood (subdivision or community):
- Percentage of people 3 years and older in K-12 schools:
Springbrook: 17.8% Silver Spring: 14.1%
- Percentage of people 3 years and older in undergraduate colleges:
Springbrook: 4.6% Silver Spring: 3.4%
- Percentage of people 3 years and older in grad. or professional schools:
Springbrook: 2.0% Silver Spring: 2.0%
- Percentage of students K-12 enrolled in private schools:
Springbrook: 56.1% Silver Spring: 12.6%
Percentage of population below poverty level:
| Springbrook: | 4.5% |
| Silver Spring: | 11.0% |
Median year owner moved in (as recorded in 2022):
| Springbrook: | 2004 |
| Silver Spring: | 2011 |
Percentage of married-couple families with both working:
| Springbrook: | 107.4% |
| Silver Spring: | 80.2% |
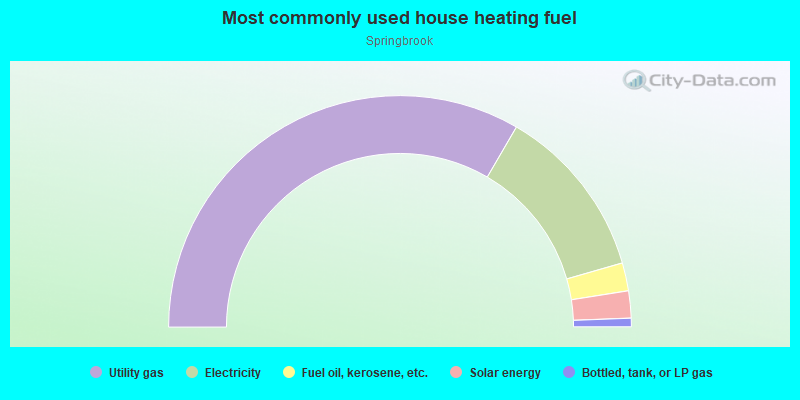
- 66.8%Utility gas
- 24.3%Electricity
- 3.9%Fuel oil, kerosene, etc.
- 3.8%Solar energy
- 1.2%Bottled, tank, or LP gas
Highways in this neighborhood:
New Hampshire Ave (State Hwy 650)
Length: 1.05 miles
Directions: N-S, SE-NW
Address range: 11900 to 12699
Directions: N-S, SE-NW
Address range: 11900 to 12699
Roads and streets:
Warrenton Dr
Length: 0.89 miles
Directions: E-W, N-S, SE-NW, SW-NE
Address range: 1 to 699
Directions: E-W, N-S, SE-NW, SW-NE
Address range: 1 to 699
Willington Dr
Length: 0.85 miles
Directions: E-W, N-S, SW-NE
Address range: 200 to 423
Directions: E-W, N-S, SW-NE
Address range: 200 to 423
Eldrid Dr
Length: 0.80 miles
Directions: E-W, SW-NE
Address range: 1 to 102
Directions: E-W, SW-NE
Address range: 1 to 102
Springbrook Dr
Length: 0.73 miles
Directions: E-W, SW-NE
Address range: 100 to 499
Directions: E-W, SW-NE
Address range: 100 to 499
Valley Brook Dr
Length: 0.70 miles
Directions: E-W, SE-NW
Address range: 100 to 699
Directions: E-W, SE-NW
Address range: 100 to 699
Blick Dr
Length: 0.50 miles
Directions: E-W, SE-NW
Address range: 300 to 699
Directions: E-W, SE-NW
Address range: 300 to 699
Sherbrook Dr
Length: 0.49 miles
Directions: E-W, SE-NW
Address range: 400 to 799
Directions: E-W, SE-NW
Address range: 400 to 799
Tanley Rd
Length: 0.39 miles
Directions: E-W, SE-NW, SW-NE
Address range: 700 to 899
Directions: E-W, SE-NW, SW-NE
Address range: 700 to 899
Davan Dr
Length: 0.34 miles
Directions: E-W, N-S, SE-NW, SW-NE
Address range: 12500 to 12699
Directions: E-W, N-S, SE-NW, SW-NE
Address range: 12500 to 12699
Two Farm Dr
Length: 0.30 miles
Directions: N-S, SW-NE
Address range: 12500 to 12699
Directions: N-S, SW-NE
Address range: 12500 to 12699
Greenhill Dr
Length: 0.28 miles
Directions: N-S, SE-NW, SW-NE
Address range: 12300 to 12599
Directions: N-S, SE-NW, SW-NE
Address range: 12300 to 12599
Meadowood Dr
Length: 0.24 miles
Directions: N-S, SW-NE
Address range: 12426 to 12699
Directions: N-S, SW-NE
Address range: 12426 to 12699
White Dr
Length: 0.21 miles
Directions: N-S, SE-NW
Address range: 12500 to 12599
Directions: N-S, SE-NW
Address range: 12500 to 12599
Greenhill Way
Length: 0.18 miles
Directions: E-W, SW-NE
Address range: 300 to 336
Directions: E-W, SW-NE
Address range: 300 to 336
Lacy Dr
Length: 0.15 miles
Direction: N-S
Address range: 12500 to 12699
Direction: N-S
Address range: 12500 to 12699
Norcross Way
Length: 0.14 miles
Directions: E-W, SW-NE
Address range: 500 to 552
Directions: E-W, SW-NE
Address range: 500 to 552
Borges Ave
Length: 0.13 miles
Direction: SW-NE
Address range: 12400 to 12499
Direction: SW-NE
Address range: 12400 to 12499
Taylor Ct
Length: 0.13 miles
Direction: SW-NE
Address range: 12600 to 12699
Direction: SW-NE
Address range: 12600 to 12699
Meadowbrook Dr
Length: 0.10 miles
Direction: E-W
Direction: E-W
Ellen Ct
Length: 0.09 miles
Direction: SW-NE
Address range: 12400 to 12499
Direction: SW-NE
Address range: 12400 to 12499
Patrick Rd
Length: 0.03 miles
Directions: N-S, SW-NE
Directions: N-S, SW-NE
Gordon Rd
Length: 0.03 miles
Direction: SE-NW
Address range: 11887 to 11902
Direction: SE-NW
Address range: 11887 to 11902
Norcross Ct
Length: 0.03 miles
Direction: SE-NW
Address range: 12600 to 12699
Direction: SE-NW
Address range: 12600 to 12699