Southmoreland neighborhood in Kansas City, Missouri (MO), 64110, 64111, 64112 detailed profile
Settings
X


Business Search - 14 Million verified businesses
Area: 0.514 square miles
Population: 3,663
Population density:
| Southmoreland: | 7,128 people per square mile |
| Kansas City: | 1,624 people per square mile |

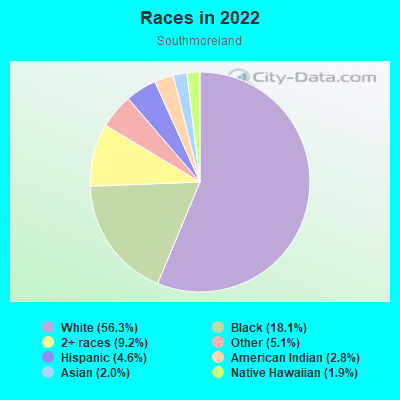
- 2,29756.3%White
- 73918.1%Black
- 3759.2%Two or more races
- 2105.1%Some other race
- 1874.6%Hispanic or Latino
- 1132.8%American Indian
- 832.0%Asian
- 771.9%Native Hawaiian and Other
Pacific Islander
Median household income in 2022:
| Southmoreland: | $70,504 |
| Kansas City: | $62,175 |
Distribution of median household income
![Distribution of median household income]()
- 75Less than $10,000
- 176$10,000 to $19,999
- 245$20,000 to $29,999
- 326$30,000 to $39,999
- 124$40,000 to $49,999
- 126$50,000 to $59,999
- 102$60,000 to $74,999
- 290$75,000 to $99,999
- 130$100,000 to $124,999
- 128$125,000 to $149,999
- 199$150,000 to $199,999
- 208$200,000 or more

Distribution of owner-occupied house/condo value
![Distribution of owner-occupied house/condo value]()
- 182Less than $50,000
- 73$50,000 to $99,999
- 114$100,000 to $149,999
- 224$150,000 to $199,999
- 114$200,000 to $249,999
- 130$250,000 to $299,999
- 99$300,000 to $399,999
- 110$400,000 to $499,999
- 126$500,000 to $749,999
- 48$750,000 to $999,999
- 54$1,000,000 or more

Distribution of rent paid by renters
![Distribution of rent paid by renters]()
- 13Less than $100
- 8$200 to $299
- 18$400 to $499
- 191$500 to $599
- 178$600 to $699
- 160$700 to $799
- 130$800 to $899
- 307$900 to $999
- 247$1,000 to $1,249
- 109$1,250 to $1,499
- 165$1,500 to $1,999
- 271$2,000 or more

Median rent in 2022:
| Southmoreland: | $990 |
| Kansas City: | $959 |
| Males: | 1,972 |
| Females: | 1,690 |
Males:
| This neighborhood: | 30.0 years |
| Whole city: | 35.3 years |
| This neighborhood: | 30.1 years |
| Whole city: | 36.6 years |
Average household size:
| Southmoreland: | 1.9 people |
| Kansas City: | 2.2 people |
Percentage of family households:
| Southmoreland: | 19.9% |
| Kansas City: | 37.9% |
| Here: | 20.4% |
| Kansas City: | 35.0% |
Percentage of married-couple families with children (among all households):
| Southmoreland: | 52.0% |
| Kansas City: | 26.7% |
Percentage of single-mother households (among all households):
| Southmoreland: | 28.3% |
| Kansas City: | 14.3% |
Percentage of never married males 15 years old and over:
Percentage of never married females 15 years old and over:
| Southmoreland: | 35.8% |
| Kansas City: | 20.0% |
Percentage of never married females 15 years old and over:
| Southmoreland: | 27.3% |
| city: | 20.0% |
Percentage of people that speak English not well or not at all:
| Southmoreland: | 0.0% |
| Kansas City: | 2.5% |
Percentage of people born in this state:
Percentage of people born in another U.S. state:
Percentage of native residents but born outside the U.S.:
Percentage of foreign born residents:
| Here: | 44.2% |
| Kansas City: | 53.2% |
Percentage of people born in another U.S. state:
| Southmoreland: | 48.3% |
| Kansas City: | 38.2% |
Percentage of native residents but born outside the U.S.:
| Here: | 0.6% |
| city: | 1.0% |
Percentage of foreign born residents:
| Here: | 7.0% |
| Kansas City: | 7.6% |

Owner-occupied
Renter-occupied


- Rooms in owner-occupied houses and condos in Southmoreland
- 251 room
- 402 rooms
- 1033 rooms
- 1224 rooms
- 1035 rooms
- 1156 rooms
- 1737 rooms
- 1258 rooms
- 1769+ rooms

- Rooms in renter-occupied apartments in Southmoreland
- 1521 room
- 452 rooms
- 2333 rooms
- 3714 rooms
- 2875 rooms
- 1096 rooms
- 497 rooms
- 558 rooms
- 1099+ rooms
Owner-occupied
Renter-occupied

- Bedrooms in owner-occupied houses and condos in Southmoreland
- 25no bedroom
- 1051 bedroom
- 2752 bedrooms
- 1533 bedrooms
- 1564 bedrooms
- 1695+ bedrooms

- Bedrooms in renter-occupied apartments in Southmoreland
- 152no bedroom
- 3571 bedroom
- 5702 bedrooms
- 733 bedrooms
- 444 bedrooms
- 735+ bedrooms
Average number of cars or other vehicles available in houses/condos:
Average number of cars or other vehicles available in apartments:
| This neighborhood: | 1.7 |
| Kansas City: | 1.9 |
Average number of cars or other vehicles available in apartments:
| Here: | 1.2 |
| city: | 1.2 |
Percentage of units with a mortgage:
| Southmoreland: | 79.5% |
| Kansas City: | 62.2% |
Average estimated value of detached houses in 2022 (25.8% of all units):
| Southmoreland: | $453,603 |
| Kansas City: | $271,492 |

- Year house built in Southmoreland
- 372020 or later
- 362010 to 2019
- 1952000 to 2009
- 2841990 to 1999
- 891980 to 1989
- 1131970 to 1979
- 5811960 to 1969
- 1811950 to 1959
- 1851940 to 1949
- 1,0841939 or earlier

City-data.com crime index for city in 2020 (higher means more crime):
| City: | 671.9 |
| U.S. average: | 219.5 |
Travel time to work (commute)
![Travel time to work (commute)]()
- 125Less than 5 minutes
- 3515 to 9 minutes
- 31810 to 14 minutes
- 45115 to 19 minutes
- 40220 to 24 minutes
- 29725 to 29 minutes
- 15930 to 34 minutes
- 1535 to 39 minutes
- 2940 to 44 minutes
- 18445 to 59 minutes
- 2460 to 89 minutes
- 2890 or more minutes

Means of transportation to work
![Means of transportation to work]()
- 66.6%1,636Drove a car alone
- 3.7%90Carpooled
- 11.4%281Bus
- 1.0%25Taxi
- 1.6%39Motorcycle
- 0.4%10Bicycle
- 6.4%158Walked
- 2.9%72Other means
- 21.8%536Worked at home

Time leaving home to go to work
![Time leaving home to go to work]()
- 4912:00 a.m. to 4:59 a.m.
- 375:00 a.m. to 5:29 a.m.
- 295:30 a.m. to 5:59 a.m.
- 826:00 a.m. to 6:29 a.m.
- 1326:30 a.m. to 6:59 a.m.
- 2577:00 a.m. to 7:29 a.m.
- 7357:30 a.m. to 7:59 a.m.
- 2948:00 a.m. to 8:29 a.m.
- 1018:30 a.m. to 8:59 a.m.
- 1999:00 a.m. to 9:59 a.m.
- 8310:00 a.m. to 10:59 a.m.
- 1211:00 a.m. to 11:59 a.m.
- 16112:00 p.m. to 3:59 p.m.
- 1074:00 p.m. to 11:59 p.m.

Occupations of males:
- Percentage of males in management occupations (except farmers):
Here: 22.5% city: 11.5%
- Percentage of males in business and financial operations occupations:
Here: 2.6% city: 5.6%
- Percentage of males in computer and mathematical occupations:
Here: 9.4% city: 6.1%
- Percentage of males in architecture and engineering occupations:
Here: 5.4% city: 3.4%
- Percentage of males in life, physical, and social science occupations:
Here: 6.4% city: 1.3%
- Percentage of males in arts, design, entertainment, sports, and media occupations:
Here: 5.1% city: 2.4%
- Percentage of males in healthcare practitioners and technical occupations:
Here: 6.5% city: 3.4%
- Percentage of males in service occupations:
Here: 10.0% city: 13.8%
- Percentage of males in sales and office occupations:
Here: 18.5% city: 16.1%
- Percentage of males in farming, fishing, and forestry occupations:
Here: 1.2% city: 0.3%
- Percentage of males in construction, extraction, and maintenance occupations:
Here: 1.7% city: 7.3%
- Percentage of males in production occupations:
Here: 2.8% city: 6.9%
- Percentage of males in transportation occupations:
Here: 2.4% city: 6.2%
- Percentage of males in material moving occupations:
Here: 1.7% city: 6.3%
Occupations of females:
- Percentage of females in management occupations (except farmers):
Here: 10.6% city: 9.9%
- Percentage of females in business and financial operations occupations:
Here: 10.8% city: 7.2%
- Percentage of females in architecture and engineering occupations:
Here: 6.3% city: 0.7%
- Percentage of females in community and social services occupations:
Here: 3.6% city: 2.9%
- Percentage of females in legal occupations:
Here: 1.6% city: 1.6%
- Percentage of females in education, training, and library occupations:
Here: 13.9% city: 8.0%
- Percentage of females in arts, design, entertainment, sports, and media occupations:
Here: 4.9% city: 2.7%
- Percentage of females in healthcare practitioners and technical occupations:
Here: 10.9% city: 10.3%
- Percentage of females in service occupations:
Here: 12.2% city: 18.7%
- Percentage of females in sales and office occupations:
Here: 21.5% city: 26.2%
- Percentage of females in transportation occupations:
Here: 1.6% city: 1.3%
- Percentage of females in material moving occupations:
Here: 1.2% city: 3.0%
Percentage of people 16-64 in Armed Forces:
| Southmoreland: | 0.2% |
| Kansas City: | 0.3% |
Education in this neighborhood (subdivision or community):
- Percentage of people 3 years and older in K-12 schools:
Southmoreland: 14.3% Kansas City: 15.8%
- Percentage of people 3 years and older in undergraduate colleges:
Southmoreland: 13.6% Kansas City: 5.0%
- Percentage of people 3 years and older in grad. or professional schools:
Southmoreland: 5.4% Kansas City: 1.7%
- Percentage of students K-12 enrolled in private schools:
Southmoreland: 43.7% Kansas City: 14.7%
Percentage of population below poverty level:
| Southmoreland: | 17.8% |
| Kansas City: | 14.6% |
Median year owner moved in (as recorded in 2022):
Median year renter moved in (as recorded in 2022):
| Southmoreland: | 2013 |
| Kansas City: | 2012 |
Median year renter moved in (as recorded in 2022):
| Southmoreland: | 2019 |
| Kansas City: | 2020 |
Percentage of married-couple families with both working:
| Southmoreland: | 102.3% |
| Kansas City: | 76.6% |

- 66.7%Utility gas
- 23.3%Electricity
- 3.8%Solar energy
- 3.6%No fuel used
- 2.6%Bottled, tank, or LP gas
Highways in this neighborhood:
US Hwy 56 (Volker Blvd)
Length: 0.36 miles
Directions: E-W, SE-NW
Address range: 176 to 499
Directions: E-W, SE-NW
Address range: 176 to 499
Roads and streets:
Oak St
Length: 0.97 miles
Direction: N-S
Address range: 3900 to 4899
Direction: N-S
Address range: 3900 to 4899
Walnut St
Length: 0.86 miles
Direction: N-S
Address range: 3900 to 4599
Direction: N-S
Address range: 3900 to 4599
Rockhill Rd
Length: 0.78 miles
Directions: E-W, N-S, SE-NW, SW-NE
Address range: 4300 to 4599
Directions: E-W, N-S, SE-NW, SW-NE
Address range: 4300 to 4599
Brush Creek Blvd
Length: 0.77 miles
Direction: E-W
Address range: 1 to 498
Direction: E-W
Address range: 1 to 498
Mc Gee St
Length: 0.77 miles
Direction: N-S
Address range: 3900 to 4899
Direction: N-S
Address range: 3900 to 4899
Warwick Blvd
Length: 0.74 miles
Directions: N-S, SE-NW
Address range: 3900 to 4699
Directions: N-S, SE-NW
Address range: 3900 to 4699
E 45th St (Warwick Blvd)
Length: 0.49 miles
Directions: E-W, N-S
Address range: 400 to 4408
Directions: E-W, N-S
Address range: 400 to 4408
E 44 St (E 44th St)
Length: 0.48 miles
Direction: E-W
Address range: 1 to 599
Direction: E-W
Address range: 1 to 599
Locust St
Length: 0.45 miles
Direction: N-S
Address range: 4200 to 4899
Direction: N-S
Address range: 4200 to 4899
E 43rd St (E 43 St)
Length: 0.43 miles
Directions: E-W, SE-NW
Address range: 100 to 599
Directions: E-W, SE-NW
Address range: 100 to 599
Main St
Length: 0.41 miles
Directions: N-S, SE-NW
Address range: 4400 to 4699
Directions: N-S, SE-NW
Address range: 4400 to 4699
E 46 St (E 46th St)
Length: 0.28 miles
Directions: E-W, SE-NW, SW-NE
Address range: 1 to 299
Directions: E-W, SE-NW, SW-NE
Address range: 1 to 299
E 40th St (E 40 St)
Length: 0.28 miles
Direction: E-W
Address range: 11 to 399
Direction: E-W
Address range: 11 to 399
E 45th St (E 45 St)
Length: 0.28 miles
Directions: E-W, SE-NW, SW-NE
Address range: 1 to 399
Directions: E-W, SE-NW, SW-NE
Address range: 1 to 399
E 39 St
Length: 0.25 miles
Direction: E-W
Address range: 100 to 399
Direction: E-W
Address range: 100 to 399
E 48th St
Length: 0.22 miles
Direction: E-W
Address range: 200 to 531
Direction: E-W
Address range: 200 to 531
Brookside Blvd
Length: 0.22 miles
Direction: SE-NW
Address range: 4841 to 4895
Direction: SE-NW
Address range: 4841 to 4895
E 47th St
Length: 0.18 miles
Direction: E-W
Address range: 301 to 499
Direction: E-W
Address range: 301 to 499
E 41 St
Length: 0.17 miles
Direction: E-W
Address range: 100 to 299
Direction: E-W
Address range: 100 to 299
Gillham Rd W
Length: 0.16 miles
Direction: N-S
Direction: N-S
E 42nd St (E 42 St)
Length: 0.16 miles
Direction: E-W
Address range: 400 to 599
Direction: E-W
Address range: 400 to 599
J C Nichols Pkwy
Length: 0.13 miles
Direction: N-S
Address range: 4600 to 4699
Direction: N-S
Address range: 4600 to 4699
J C Nichols Pkwy (Baltimore Ave)
Length: 0.12 miles
Direction: N-S
Address range: 4700 to 4785
Direction: N-S
Address range: 4700 to 4785
W 47th St
Length: 0.09 miles
Direction: E-W
Address range: 1 to 99
Direction: E-W
Address range: 1 to 99
W 47 St
Length: 0.08 miles
Direction: E-W
Direction: E-W
W 44 St (W 44th St)
Length: 0.06 miles
Direction: E-W
Address range: 1 to 99
Direction: E-W
Address range: 1 to 99
Grand Ave
Length: 0.05 miles
Direction: N-S
Address range: 4700 to 4799
Direction: N-S
Address range: 4700 to 4799
W 43rd St (W 43 St)
Length: 0.04 miles
Direction: E-W
Address range: 100 to 199
Direction: E-W
Address range: 100 to 199
Railroad features:
Kansas City Southern Rlwy
Length: 0.83 miles
Directions: N-S, SE-NW
Directions: N-S, SE-NW
Other features:
Brush Crk
Length: 0.38 miles
Directions: E-W, SE-NW
Directions: E-W, SE-NW