South Park neighborhood in Raleigh, North Carolina (NC), 27601, 27610 detailed profile
Settings
X

Business Search - 14 Million verified businesses
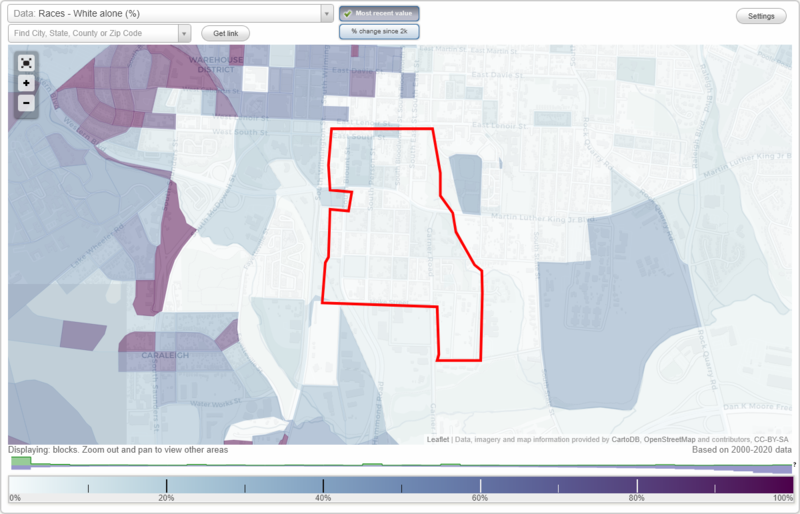
Area: 0.318 square miles
Population: 1,378
Population density:
| South Park: | 4,327 people per square mile |
| Raleigh: | 4,163 people per square mile |

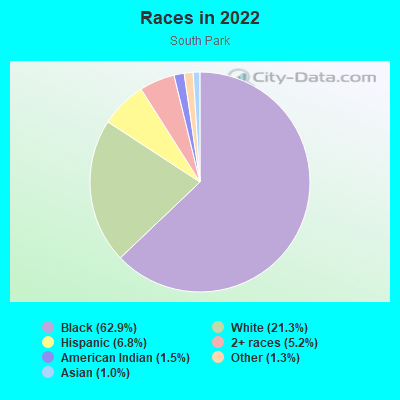
- 88762.9%Black
- 30121.3%White
- 966.8%Hispanic or Latino
- 735.2%Two or more races
- 211.5%American Indian
- 191.3%Some other race
- 141.0%Asian
Median household income in 2022:
| South Park: | $40,602 |
| Raleigh: | $75,424 |
Distribution of median household income
![Distribution of median household income]()
- 38Less than $10,000
- 67$10,000 to $19,999
- 130$20,000 to $29,999
- 104$30,000 to $39,999
- 89$40,000 to $49,999
- 40$50,000 to $59,999
- 57$60,000 to $74,999
- 31$75,000 to $99,999
- 11$100,000 to $124,999
- 20$125,000 to $149,999
- 37$150,000 to $199,999
- 41$200,000 or more

Distribution of owner-occupied house/condo value
![Distribution of owner-occupied house/condo value]()
- 16Less than $50,000
- 10$50,000 to $99,999
- 18$100,000 to $149,999
- 29$150,000 to $199,999
- 22$200,000 to $249,999
- 15$250,000 to $299,999
- 20$300,000 to $399,999
- 53$400,000 to $499,999
- 30$500,000 to $749,999
- 14$750,000 to $999,999

Distribution of rent paid by renters
![Distribution of rent paid by renters]()
- 52Less than $100
- 16$100 to $199
- 18$200 to $299
- 56$300 to $399
- 40$400 to $499
- 50$500 to $599
- 56$600 to $699
- 63$700 to $799
- 93$800 to $899
- 152$900 to $999
- 50$1,000 to $1,249
- 42$1,250 to $1,499
- 15$1,500 to $1,999
- 13$2,000 or more

Median rent in 2022:
| South Park: | $826 |
| Raleigh: | $1,309 |
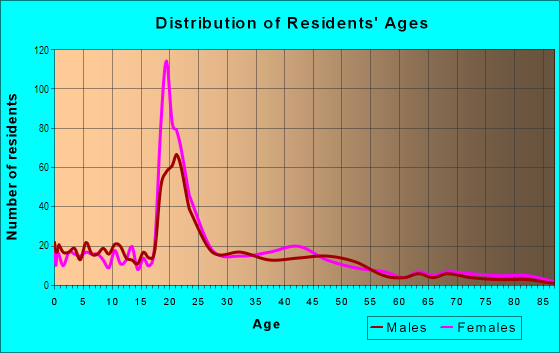
| Males: | 592 |
| Females: | 786 |
Males:
| This neighborhood: | 35.0 years |
| Whole city: | 33.9 years |
| This neighborhood: | 30.1 years |
| Whole city: | 35.8 years |
Average household size:
| South Park: | 2.2 people |
| Raleigh: | 2.3 people |
Percentage of family households:
| South Park: | 36.5% |
| Raleigh: | 41.5% |
| Here: | 10.5% |
| Raleigh: | 39.7% |
Percentage of married-couple families with children (among all households):
| South Park: | 6.9% |
| Raleigh: | 28.1% |
Percentage of single-mother households (among all households):
| South Park: | 33.8% |
| Raleigh: | 10.7% |
Percentage of never married males 15 years old and over:
Percentage of never married females 15 years old and over:
| South Park: | 26.8% |
| Raleigh: | 22.3% |
Percentage of never married females 15 years old and over:
| South Park: | 38.3% |
| city: | 21.9% |
Percentage of people that speak English not well or not at all:
| South Park: | 2.0% |
| Raleigh: | 2.3% |
Percentage of people born in this state:
Percentage of people born in another U.S. state:
Percentage of native residents but born outside the U.S.:
Percentage of foreign born residents:
| Here: | 67.5% |
| Raleigh: | 44.8% |
Percentage of people born in another U.S. state:
| South Park: | 27.2% |
| Raleigh: | 39.8% |
Percentage of native residents but born outside the U.S.:
| Here: | 0.1% |
| city: | 1.9% |
Percentage of foreign born residents:
| Here: | 5.2% |
| Raleigh: | 13.5% |
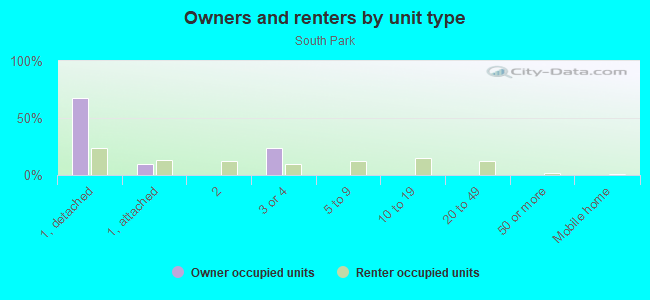
Owner-occupied
Renter-occupied

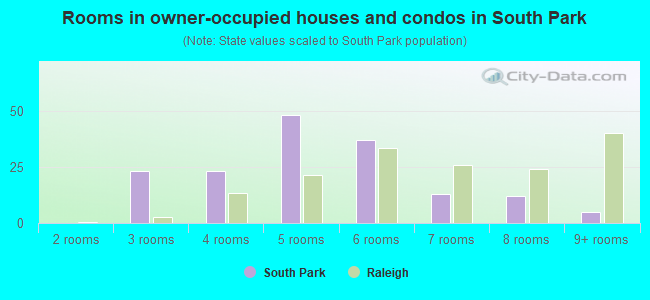
- Rooms in owner-occupied houses and condos in South Park
- 01 room
- 02 rooms
- 233 rooms
- 234 rooms
- 485 rooms
- 376 rooms
- 137 rooms
- 128 rooms
- 59+ rooms
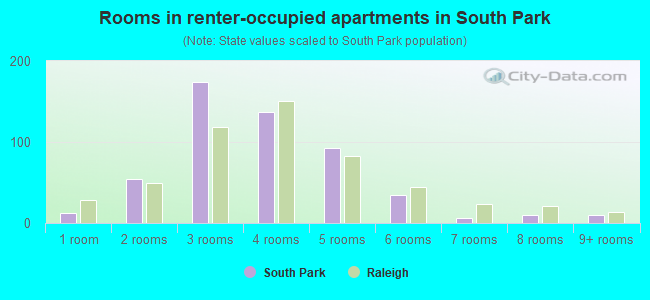
- Rooms in renter-occupied apartments in South Park
- 121 room
- 542 rooms
- 1743 rooms
- 1374 rooms
- 935 rooms
- 356 rooms
- 67 rooms
- 108 rooms
- 109+ rooms
Owner-occupied
Renter-occupied
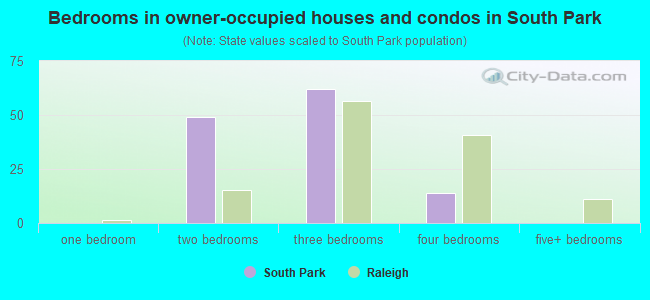
- Bedrooms in owner-occupied houses and condos in South Park
- 0no bedroom
- 01 bedroom
- 492 bedrooms
- 623 bedrooms
- 144 bedrooms
- 05+ bedrooms
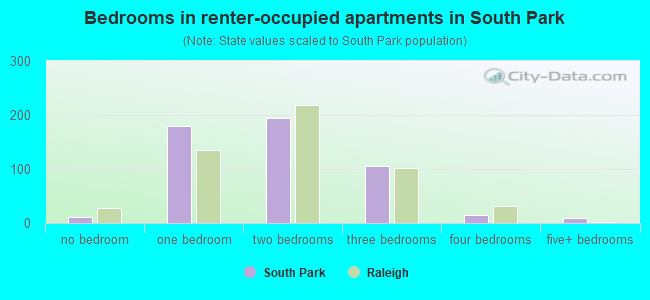
- Bedrooms in renter-occupied apartments in South Park
- 12no bedroom
- 1791 bedroom
- 1952 bedrooms
- 1053 bedrooms
- 144 bedrooms
- 105+ bedrooms
Average number of cars or other vehicles available in houses/condos:
Average number of cars or other vehicles available in apartments:
| This neighborhood: | 1.5 |
| Raleigh: | 2.0 |
Average number of cars or other vehicles available in apartments:
| Here: | 0.8 |
| city: | 1.4 |
Percentage of units with a mortgage:
| South Park: | 72.9% |
| Raleigh: | 74.4% |
Average estimated value of detached houses in 2022 (38.0% of all units):
| South Park: | $417,235 |
| North Carolina: | $375,326 |
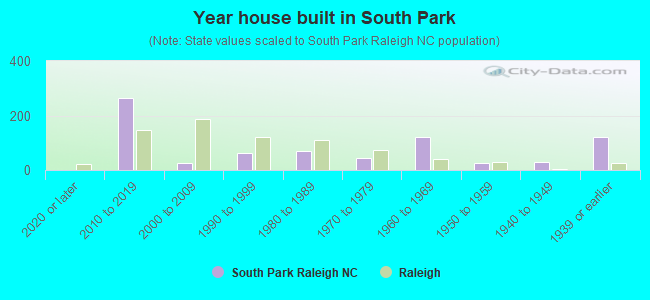
- Year house built in South Park
- 02020 or later
- 2652010 to 2019
- 252000 to 2009
- 621990 to 1999
- 691980 to 1989
- 451970 to 1979
- 1201960 to 1969
- 241950 to 1959
- 291940 to 1949
- 1201939 or earlier
City-data.com crime index for city in 2020 (higher means more crime):
| City: | 216.7 |
| U.S. average: | 219.5 |
Travel time to work (commute)
![Travel time to work (commute)]()
- 7Less than 5 minutes
- 525 to 9 minutes
- 8710 to 14 minutes
- 6215 to 19 minutes
- 13120 to 24 minutes
- 2325 to 29 minutes
- 9030 to 34 minutes
- 635 to 39 minutes
- 4640 to 44 minutes
- 2445 to 59 minutes
- 860 to 89 minutes
- 1490 or more minutes

Means of transportation to work
![Means of transportation to work]()
- 57.6%386Drove a car alone
- 7.0%47Carpooled
- 10.3%69Bus
- 4.2%28Taxi
- 1.9%13Bicycle
- 13.4%90Walked
- 1.3%9Other means
- 15.1%101Worked at home

Time leaving home to go to work
![Time leaving home to go to work]()
- 2212:00 a.m. to 4:59 a.m.
- 205:00 a.m. to 5:29 a.m.
- 295:30 a.m. to 5:59 a.m.
- 726:00 a.m. to 6:29 a.m.
- 176:30 a.m. to 6:59 a.m.
- 797:00 a.m. to 7:29 a.m.
- 377:30 a.m. to 7:59 a.m.
- 958:00 a.m. to 8:29 a.m.
- 338:30 a.m. to 8:59 a.m.
- 229:00 a.m. to 9:59 a.m.
- 4110:00 a.m. to 10:59 a.m.
- 3411:00 a.m. to 11:59 a.m.
- 4112:00 p.m. to 3:59 p.m.
- 274:00 p.m. to 11:59 p.m.

Occupations of males:
- Percentage of males in management occupations (except farmers):
Here: 4.8% city: 14.5%
- Percentage of males in business and financial operations occupations:
Here: 7.2% city: 7.5%
- Percentage of males in computer and mathematical occupations:
Here: 8.1% city: 9.1%
- Percentage of males in education, training, and library occupations:
Here: 8.7% city: 3.6%
- Percentage of males in arts, design, entertainment, sports, and media occupations:
Here: 2.5% city: 2.5%
- Percentage of males in service occupations:
Here: 41.2% city: 11.6%
- Percentage of males in sales and office occupations:
Here: 11.8% city: 16.9%
- Percentage of males in construction, extraction, and maintenance occupations:
Here: 2.7% city: 6.8%
- Percentage of males in production occupations:
Here: 4.9% city: 3.4%
- Percentage of males in transportation occupations:
Here: 3.6% city: 4.9%
- Percentage of males in material moving occupations:
Here: 1.3% city: 4.0%
Occupations of females:
- Percentage of females in management occupations (except farmers):
Here: 8.4% city: 12.5%
- Percentage of females in business and financial operations occupations:
Here: 4.7% city: 10.5%
- Percentage of females in life, physical, and social science occupations:
Here: 2.1% city: 2.0%
- Percentage of females in education, training, and library occupations:
Here: 8.9% city: 8.8%
- Percentage of females in arts, design, entertainment, sports, and media occupations:
Here: 1.1% city: 2.9%
- Percentage of females in healthcare practitioners and technical occupations:
Here: 6.3% city: 8.8%
- Percentage of females in service occupations:
Here: 35.0% city: 15.9%
- Percentage of females in sales and office occupations:
Here: 27.8% city: 24.5%
- Percentage of females in construction, extraction, and maintenance occupations:
Here: 2.0% city: 0.4%
- Percentage of females in production occupations:
Here: 1.0% city: 2.1%
Percentage of people 16-64 in Armed Forces:
| South Park: | 0.1% |
| Raleigh: | 0.1% |
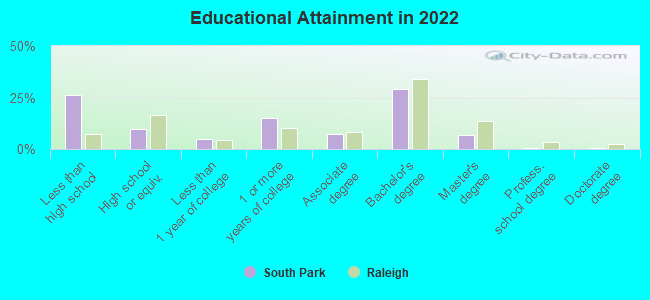
Education in this neighborhood (subdivision or community):
- Percentage of people 3 years and older in K-12 schools:
South Park: 21.8% Raleigh: 14.0%
- Percentage of people 3 years and older in undergraduate colleges:
South Park: 20.9% Raleigh: 8.1%
- Percentage of people 3 years and older in grad. or professional schools:
South Park: 2.5% Raleigh: 2.4%
- Percentage of students K-12 enrolled in private schools:
South Park: 54.4% Raleigh: 10.9%
Percentage of population below poverty level:
| South Park: | 26.2% |
| Raleigh: | 11.0% |
Median year owner moved in (as recorded in 2022):
Median year renter moved in (as recorded in 2022):
| South Park: | 2010 |
| Raleigh: | 2013 |
Median year renter moved in (as recorded in 2022):
| South Park: | 2017 |
| Raleigh: | 2020 |
Percentage of married-couple families with both working:
| South Park: | 149.1% |
| Raleigh: | 76.8% |
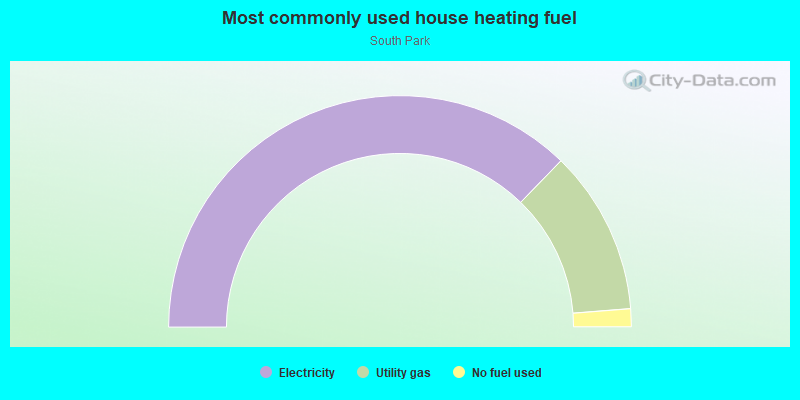
- 74.5%Electricity
- 23.0%Utility gas
- 2.5%No fuel used
Roads and streets:
S Person St
Length: 0.59 miles
Direction: N-S
Address range: 700 to 1399
Direction: N-S
Address range: 700 to 1399
S East St
Length: 0.59 miles
Direction: N-S
Address range: 700 to 1399
Direction: N-S
Address range: 700 to 1399
S Bloodworth St
Length: 0.52 miles
Direction: N-S
Address range: 700 to 1399
Direction: N-S
Address range: 700 to 1399
S Blount St
Length: 0.44 miles
Directions: N-S, SE-NW
Address range: 700 to 1375
Directions: N-S, SE-NW
Address range: 700 to 1375
Garner Rd
Length: 0.44 miles
Directions: N-S, SE-NW, SW-NE
Address range: 1001 to 1398
Directions: N-S, SE-NW, SW-NE
Address range: 1001 to 1398
Smithfield St (Martin Luther King Jr Blvd)
Length: 0.42 miles
Directions: E-W, SE-NW
Address range: 200 to 499
Directions: E-W, SE-NW
Address range: 200 to 499
Branch St
Length: 0.40 miles
Direction: E-W
Address range: 200 to 599
Direction: E-W
Address range: 200 to 599
E Bragg St
Length: 0.39 miles
Direction: E-W
Address range: 200 to 518
Direction: E-W
Address range: 200 to 518
Hoke St
Length: 0.37 miles
Direction: E-W
Address range: 206 to 599
Direction: E-W
Address range: 206 to 599
E South St
Length: 0.33 miles
Direction: E-W
Address range: 166 to 599
Direction: E-W
Address range: 166 to 599
E Lee St
Length: 0.29 miles
Direction: E-W
Address range: 200 to 499
Direction: E-W
Address range: 200 to 499
Worth St
Length: 0.24 miles
Direction: E-W
Address range: 300 to 598
Direction: E-W
Address range: 300 to 598
Carnage Dr
Length: 0.24 miles
Direction: N-S
Address range: 1400 to 1599
Direction: N-S
Address range: 1400 to 1599
Sawyer Rd
Length: 0.24 miles
Direction: N-S
Address range: 1400 to 1714
Direction: N-S
Address range: 1400 to 1714
Ellington St
Length: 0.21 miles
Direction: N-S
Address range: 710 to 899
Direction: N-S
Address range: 710 to 899
McMakin St
Length: 0.21 miles
Direction: E-W
Address range: 600 to 802
Direction: E-W
Address range: 600 to 802
Bledsoe Ave
Length: 0.18 miles
Direction: E-W
Address range: 300 to 499
Direction: E-W
Address range: 300 to 499
Cape Ave
Length: 0.12 miles
Directions: E-W, N-S
Address range: 500 to 699
Directions: E-W, N-S
Address range: 500 to 699
Peterson St
Length: 0.10 miles
Direction: E-W
Address range: 700 to 799
Direction: E-W
Address range: 700 to 799
Mangum St
Length: 0.08 miles
Direction: N-S
Address range: 1200 to 1299
Direction: N-S
Address range: 1200 to 1299
Martin Luther King Jr Blvd
Length: 0.07 miles
Direction: E-W
Address range: 501 to 533
Direction: E-W
Address range: 501 to 533
Top Greene Ln
Length: 0.03 miles
Direction: E-W
Address range: 400 to 499
Direction: E-W
Address range: 400 to 499
Sawyer Ct
Length: 0.03 miles
Directions: N-S, SE-NW
Address range: 1200 to 1239
Directions: N-S, SE-NW
Address range: 1200 to 1239