South Millville Industrial Park neighborhood in Millville, New Jersey (NJ), 08332 detailed profile
Settings
X


Business Search - 14 Million verified businesses
Area: 0.837 square miles
Population: 702
Population density:
| South Millville Industrial Park: | 839 people per square mile |
| Millville: | 650 people per square mile |

- 34549.1%White
- 18025.6%Hispanic or Latino
- 15121.5%Black
- 182.6%Two or more races
- 91.3%Asian

Median household income in 2022:
| South Millville Industrial Park: | $63,550 |
| Millville: | $65,279 |
Distribution of median household income
![Distribution of median household income]()
- 17Less than $10,000
- 34$10,000 to $19,999
- 28$20,000 to $29,999
- 58$30,000 to $39,999
- 44$40,000 to $49,999
- 22$50,000 to $59,999
- 42$60,000 to $74,999
- 48$75,000 to $99,999
- 34$100,000 to $124,999
- 10$125,000 to $149,999
- 5$150,000 to $199,999
- 12$200,000 or more

Distribution of owner-occupied house/condo value
![Distribution of owner-occupied house/condo value]()
- 35Less than $50,000
- 27$50,000 to $99,999
- 28$100,000 to $149,999
- 73$150,000 to $199,999
- 66$200,000 to $249,999
- 78$250,000 to $299,999
- 2$400,000 to $499,999
- 20$1,000,000 or more

Distribution of rent paid by renters
![Distribution of rent paid by renters]()
- 17$100 to $199
- 12$200 to $299
- 17$400 to $499
- 3$700 to $799
- 3$800 to $899
- 4$900 to $999
- 39$1,000 to $1,249
- 10$2,000 or more

Median rent in 2022:
| South Millville Industrial Park: | $1,070 |
| Millville: | $920 |
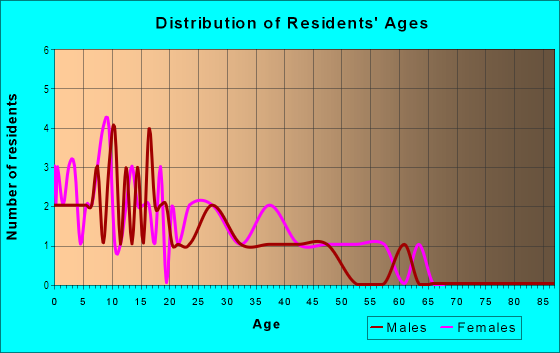
| Males: | 337 |
| Females: | 365 |
Males:
| This neighborhood: | 39.5 years |
| Whole city: | 39.6 years |
| This neighborhood: | 37.8 years |
| Whole city: | 46.0 years |
Average household size:
| South Millville Industrial Park: | 2.6 people |
| Millville: | 2.3 people |
Percentage of family households:
| South Millville Industrial Park: | 42.3% |
| Millville: | 42.1% |
| Here: | 38.7% |
| Millville: | 40.7% |
Percentage of married-couple families with children (among all households):
| South Millville Industrial Park: | 23.6% |
| Millville: | 24.7% |
Percentage of single-mother households (among all households):
| South Millville Industrial Park: | 7.3% |
| Millville: | 15.1% |
Percentage of never married males 15 years old and over:
Percentage of never married females 15 years old and over:
| South Millville Industrial Park: | 21.1% |
| Millville: | 19.4% |
Percentage of never married females 15 years old and over:
| South Millville Industrial Park: | 15.3% |
| city: | 15.1% |
Percentage of people that speak English not well or not at all:
| South Millville Industrial Park: | 3.2% |
| Millville: | 2.5% |
Percentage of people born in this state:
Percentage of people born in another U.S. state:
Percentage of native residents but born outside the U.S.:
Percentage of foreign born residents:
| Here: | 73.6% |
| Millville: | 74.5% |
Percentage of people born in another U.S. state:
| South Millville Industrial Park: | 15.7% |
| Millville: | 15.4% |
Percentage of native residents but born outside the U.S.:
| Here: | 3.3% |
| city: | 3.2% |
Percentage of foreign born residents:
| Here: | 7.4% |
| Millville: | 7.0% |

Owner-occupied
Renter-occupied


- Rooms in owner-occupied houses and condos in South Millville Industrial Park
- 01 room
- 02 rooms
- 13 rooms
- 374 rooms
- 545 rooms
- 466 rooms
- 417 rooms
- 238 rooms
- 99+ rooms

- Rooms in renter-occupied apartments in South Millville Industrial Park
- 01 room
- 02 rooms
- 103 rooms
- 184 rooms
- 05 rooms
- 556 rooms
- 07 rooms
- 08 rooms
- 629+ rooms
Owner-occupied
Renter-occupied

- Bedrooms in owner-occupied houses and condos in South Millville Industrial Park
- 0no bedroom
- 41 bedroom
- 492 bedrooms
- 1343 bedrooms
- 254 bedrooms
- 05+ bedrooms

- Bedrooms in renter-occupied apartments in South Millville Industrial Park
- 0no bedroom
- 191 bedroom
- 102 bedrooms
- 1083 bedrooms
- 04 bedrooms
- 95+ bedrooms
Average number of cars or other vehicles available in houses/condos:
Average number of cars or other vehicles available in apartments:
| This neighborhood: | 1.6 |
| Millville: | 2.0 |
Average number of cars or other vehicles available in apartments:
| Here: | 1.6 |
| city: | 0.9 |
Percentage of units with a mortgage:
| South Millville Industrial Park: | 50.0% |
| Millville: | 62.3% |

- Year house built in South Millville Industrial Park
- 02020 or later
- 802010 to 2019
- 552000 to 2009
- 261990 to 1999
- 211980 to 1989
- 171970 to 1979
- 441960 to 1969
- 251950 to 1959
- 1221940 to 1949
- 311939 or earlier

City-data.com crime index for city in 2020 (higher means more crime):
| City: | 326.3 |
| U.S. average: | 219.5 |
Travel time to work (commute)
![Travel time to work (commute)]()
- 325 to 9 minutes
- 6410 to 14 minutes
- 6515 to 19 minutes
- 4320 to 24 minutes
- 1325 to 29 minutes
- 830 to 34 minutes
- 935 to 39 minutes
- 840 to 44 minutes
- 1445 to 59 minutes
- 1160 to 89 minutes

Means of transportation to work
![Means of transportation to work]()
- 94.4%287Drove a car alone
- 2.3%7Carpooled
- 4.6%14Other means
- 1.6%5Worked at home

Time leaving home to go to work
![Time leaving home to go to work]()
- 2312:00 a.m. to 4:59 a.m.
- 125:00 a.m. to 5:29 a.m.
- 185:30 a.m. to 5:59 a.m.
- 66:00 a.m. to 6:29 a.m.
- 236:30 a.m. to 6:59 a.m.
- 337:00 a.m. to 7:29 a.m.
- 467:30 a.m. to 7:59 a.m.
- 328:00 a.m. to 8:29 a.m.
- 108:30 a.m. to 8:59 a.m.
- 19:00 a.m. to 9:59 a.m.
- 2912:00 p.m. to 3:59 p.m.
- 304:00 p.m. to 11:59 p.m.

Occupations of males:
- Percentage of males in management occupations (except farmers):
Here: 11.7% city: 4.1%
- Percentage of males in arts, design, entertainment, sports, and media occupations:
Here: 1.4% city: 1.9%
- Percentage of males in healthcare practitioners and technical occupations:
Here: 2.0% city: 1.3%
- Percentage of males in service occupations:
Here: 31.3% city: 23.8%
- Percentage of males in sales and office occupations:
Here: 4.0% city: 8.0%
- Percentage of males in construction, extraction, and maintenance occupations:
Here: 8.1% city: 14.1%
- Percentage of males in production occupations:
Here: 5.3% city: 9.0%
- Percentage of males in transportation occupations:
Here: 9.5% city: 6.5%
- Percentage of males in material moving occupations:
Here: 14.7% city: 10.7%
Occupations of females:
- Percentage of females in management occupations (except farmers):
Here: 13.5% city: 6.5%
- Percentage of females in community and social services occupations:
Here: 6.9% city: 2.4%
- Percentage of females in education, training, and library occupations:
Here: 6.9% city: 5.2%
- Percentage of females in arts, design, entertainment, sports, and media occupations:
Here: 4.6% city: 1.4%
- Percentage of females in healthcare practitioners and technical occupations:
Here: 15.7% city: 12.8%
- Percentage of females in service occupations:
Here: 20.3% city: 31.2%
- Percentage of females in sales and office occupations:
Here: 21.0% city: 24.0%
- Percentage of females in production occupations:
Here: 3.6% city: 6.8%
- Percentage of females in transportation occupations:
Here: 3.4% city: 2.6%
Education in this neighborhood (subdivision or community):
- Percentage of people 3 years and older in K-12 schools:
South Millville Industrial Park: 51.1% Millville: 16.0%
- Percentage of people 3 years and older in undergraduate colleges:
South Millville Industrial Park: 1.2% Millville: 3.5%
- Percentage of people 3 years and older in grad. or professional schools:
South Millville Industrial Park: 5.0% Millville: 0.7%
- Percentage of students K-12 enrolled in private schools:
South Millville Industrial Park: 10.1% Millville: 2.1%
Percentage of population below poverty level:
| South Millville Industrial Park: | 9.4% |
| Millville: | 11.4% |
Median year owner moved in (as recorded in 2022):
Median year renter moved in (as recorded in 2022):
| South Millville Industrial Park: | 2004 |
| Millville: | 2002 |
Median year renter moved in (as recorded in 2022):
| South Millville Industrial Park: | 2013 |
| Millville: | 2016 |
Percentage of married-couple families with both working:
| South Millville Industrial Park: | 257.1% |
| Millville: | 80.1% |

- 77.5%Utility gas
- 12.0%Fuel oil, kerosene, etc.
- 3.7%Electricity
- 2.6%Solar energy
- 2.1%Bottled, tank, or LP gas
- 2.1%Wood
Highways in this neighborhood:
State Rte 55
Length: 1.14 miles
Direction: N-S
Direction: N-S
Roads and streets:
Eden Rd
Length: 1.03 miles
Directions: N-S, SE-NW, SW-NE
Address range: 1600 to 2199
Directions: N-S, SE-NW, SW-NE
Address range: 1600 to 2199
S Wade Blvd
Length: 0.93 miles
Directions: N-S, SE-NW, SW-NE
Address range: 766 to 1599
Directions: N-S, SE-NW, SW-NE
Address range: 766 to 1599
T-Fal Dr
Length: 0.39 miles
Directions: E-W, N-S, SE-NW, SW-NE
Directions: E-W, N-S, SE-NW, SW-NE
Orange St
Length: 0.35 miles
Directions: E-W, SW-NE
Address range: 528 to 899
Directions: E-W, SW-NE
Address range: 528 to 899
Gorton Rd
Length: 0.16 miles
Directions: E-W, SE-NW
Directions: E-W, SE-NW
Railroad features:
Penn Central RR
Length: 0.16 miles
Direction: SE-NW
Direction: SE-NW