San Vicente neighborhood in Concord, California (CA), 94519 detailed profile
Settings
X


Business Search - 14 Million verified businesses
Area: 0.066 square miles
Population: 794
Population density:
| San Vicente: | 12,070 people per square mile |
| Concord: | 4,069 people per square mile |

- 59966.0%Hispanic or Latino
- 12914.2%Asian
- 9610.6%Two or more races
- 657.2%White
- 91.0%Black
- 91.0%Some other race

Distribution of median household income
![Distribution of median household income]()
- 9Less than $10,000
- 31$10,000 to $19,999
- 21$20,000 to $29,999
- 10$30,000 to $39,999
- 9$40,000 to $49,999
- 4$50,000 to $59,999
- 63$60,000 to $74,999
- 8$75,000 to $99,999
- 37$100,000 to $124,999
- 36$125,000 to $149,999
- 23$150,000 to $199,999
- 19$200,000 or more

Distribution of owner-occupied house/condo value
![Distribution of owner-occupied house/condo value]()
- 10Less than $50,000
- 2$50,000 to $99,999
- 2$250,000 to $299,999
- 16$300,000 to $399,999
- 17$400,000 to $499,999
- 69$500,000 to $749,999
- 8$750,000 to $999,999
- 5$1,000,000 or more

Distribution of rent paid by renters
![Distribution of rent paid by renters]()
- 1$800 to $899
- 5$1,000 to $1,249
- 3$1,250 to $1,499
- 47$1,500 to $1,999
- 67$2,000 or more

Median rent in 2022:
| San Vicente: | $2,075 |
| Concord: | $1,824 |
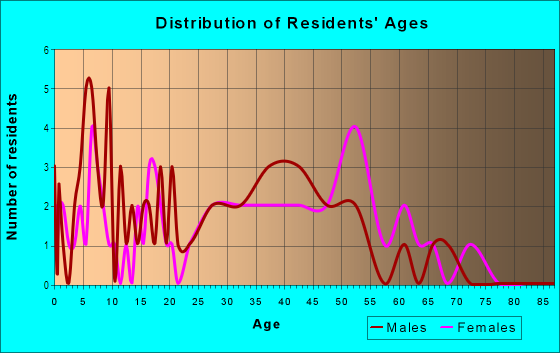
| Males: | 372 |
| Females: | 422 |
Males:
| This neighborhood: | 34.7 years |
| Whole city: | 38.7 years |
| This neighborhood: | 38.0 years |
| Whole city: | 43.1 years |
Average household size:
| San Vicente: | 3.4 people |
| Concord: | 2.6 people |
Percentage of family households:
| San Vicente: | 71.7% |
| Concord: | 49.2% |
| Here: | 35.4% |
| Concord: | 50.7% |
Percentage of married-couple families with children (among all households):
| San Vicente: | 3.0% |
| Concord: | 30.3% |
Percentage of single-mother households (among all households):
| San Vicente: | 8.4% |
| Concord: | 5.5% |
Percentage of never married males 15 years old and over:
Percentage of never married females 15 years old and over:
| San Vicente: | 27.3% |
| Concord: | 20.6% |
Percentage of never married females 15 years old and over:
| San Vicente: | 25.0% |
| city: | 13.6% |
Percentage of people that speak English not well or not at all:
| San Vicente: | 10.6% |
| Concord: | 9.7% |
Percentage of people born in this state:
Percentage of people born in another U.S. state:
Percentage of native residents but born outside the U.S.:
Percentage of foreign born residents:
| Here: | 60.2% |
| Concord: | 54.6% |
Percentage of people born in another U.S. state:
| San Vicente: | 13.6% |
| Concord: | 15.0% |
Percentage of native residents but born outside the U.S.:
| Here: | 1.5% |
| city: | 1.8% |
Percentage of foreign born residents:
| Here: | 24.7% |
| Concord: | 28.5% |

Owner-occupied
Renter-occupied


- Rooms in owner-occupied houses and condos in San Vicente
- 01 room
- 02 rooms
- 33 rooms
- 524 rooms
- 105 rooms
- 286 rooms
- 227 rooms
- 458 rooms
- 129+ rooms

- Rooms in renter-occupied apartments in San Vicente
- 31 room
- 42 rooms
- 513 rooms
- 504 rooms
- 145 rooms
- 76 rooms
- 37 rooms
- 08 rooms
- 09+ rooms
Owner-occupied
Renter-occupied

- Bedrooms in owner-occupied houses and condos in San Vicente
- 1no bedroom
- 01 bedroom
- 382 bedrooms
- 183 bedrooms
- 594 bedrooms
- 45+ bedrooms

- Bedrooms in renter-occupied apartments in San Vicente
- 3no bedroom
- 111 bedroom
- 912 bedrooms
- 103 bedrooms
- 34 bedrooms
- 05+ bedrooms
Average number of cars or other vehicles available in houses/condos:
Average number of cars or other vehicles available in apartments:
| This neighborhood: | 2.7 |
| Concord: | 2.0 |
Average number of cars or other vehicles available in apartments:
| Here: | 1.2 |
| city: | 1.8 |
Percentage of units with a mortgage:
| San Vicente: | 61.9% |
| Concord: | 74.7% |
Average estimated value of detached houses in 2022 (45.7% of all units):
| San Vicente: | $723,400 |
| Concord: | $929,891 |

- Year house built in San Vicente
- 12020 or later
- 02010 to 2019
- 282000 to 2009
- 151990 to 1999
- 241980 to 1989
- 391970 to 1979
- 441960 to 1969
- 621950 to 1959
- 261940 to 1949
- 191939 or earlier

City-data.com crime index for city in 2020 (higher means more crime):
| City: | 247.0 |
| U.S. average: | 219.5 |
Travel time to work (commute)
![Travel time to work (commute)]()
- 95 to 9 minutes
- 1510 to 14 minutes
- 3815 to 19 minutes
- 2520 to 24 minutes
- 325 to 29 minutes
- 3130 to 34 minutes
- 935 to 39 minutes
- 640 to 44 minutes
- 2245 to 59 minutes
- 3460 to 89 minutes
- 1290 or more minutes

Means of transportation to work
![Means of transportation to work]()
- 54.3%204Drove a car alone
- 5.6%21Carpooled
- 4.5%17Bus
- 11.5%43Subway or elevated rail
- 0.3%1Long-distance train or commuter rail
- 1.3%5Walked
- 0.3%1Other means
- 23.4%88Worked at home

Time leaving home to go to work
![Time leaving home to go to work]()
- 1512:00 a.m. to 4:59 a.m.
- 45:00 a.m. to 5:29 a.m.
- 55:30 a.m. to 5:59 a.m.
- 236:00 a.m. to 6:29 a.m.
- 186:30 a.m. to 6:59 a.m.
- 297:00 a.m. to 7:29 a.m.
- 307:30 a.m. to 7:59 a.m.
- 148:00 a.m. to 8:29 a.m.
- 98:30 a.m. to 8:59 a.m.
- 329:00 a.m. to 9:59 a.m.
- 610:00 a.m. to 10:59 a.m.
- 111:00 a.m. to 11:59 a.m.
- 1212:00 p.m. to 3:59 p.m.
- 94:00 p.m. to 11:59 p.m.

Occupations of males:
- Percentage of males in management occupations (except farmers):
Here: 10.7% city: 13.4%
- Percentage of males in business and financial operations occupations:
Here: 1.1% city: 5.8%
- Percentage of males in computer and mathematical occupations:
Here: 4.5% city: 5.5%
- Percentage of males in education, training, and library occupations:
Here: 7.8% city: 2.9%
- Percentage of males in arts, design, entertainment, sports, and media occupations:
Here: 5.4% city: 1.9%
- Percentage of males in healthcare practitioners and technical occupations:
Here: 3.8% city: 1.9%
- Percentage of males in service occupations:
Here: 2.4% city: 19.4%
- Percentage of males in sales and office occupations:
Here: 2.2% city: 13.6%
- Percentage of males in farming, fishing, and forestry occupations:
Here: 9.7% city: 0.2%
- Percentage of males in construction, extraction, and maintenance occupations:
Here: 19.9% city: 10.0%
- Percentage of males in production occupations:
Here: 3.6% city: 4.8%
- Percentage of males in transportation occupations:
Here: 15.6% city: 5.6%
Occupations of females:
- Percentage of females in business and financial operations occupations:
Here: 9.1% city: 7.7%
- Percentage of females in computer and mathematical occupations:
Here: 2.4% city: 1.6%
- Percentage of females in community and social services occupations:
Here: 2.1% city: 2.0%
- Percentage of females in healthcare practitioners and technical occupations:
Here: 4.0% city: 8.0%
- Percentage of females in service occupations:
Here: 56.1% city: 24.0%
- Percentage of females in sales and office occupations:
Here: 26.1% city: 25.7%
- Percentage of females in material moving occupations:
Here: 2.1% city: 1.4%
Education in this neighborhood (subdivision or community):
- Percentage of people 3 years and older in K-12 schools:
San Vicente: 29.7% Concord: 14.7%
- Percentage of people 3 years and older in undergraduate colleges:
San Vicente: 10.0% Concord: 5.5%
- Percentage of people 3 years and older in grad. or professional schools:
San Vicente: 0.7% Concord: 1.5%
- Percentage of students K-12 enrolled in private schools:
San Vicente: 14.9% Concord: 13.5%
Percentage of population below poverty level:
| San Vicente: | 6.5% |
| Concord: | 8.8% |
Median year owner moved in (as recorded in 2022):
Median year renter moved in (as recorded in 2022):
| San Vicente: | 2006 |
| Concord: | 2008 |
Median year renter moved in (as recorded in 2022):
| San Vicente: | 2016 |
| Concord: | 2018 |
Percentage of married-couple families with both working:
| San Vicente: | 102.2% |
| Concord: | 80.0% |

- 76.4%Utility gas
- 10.6%Electricity
- 5.8%Wood
- 2.6%Solar energy
- 2.6%No fuel used
- 2.1%Bottled, tank, or LP gas
Roads and streets:
San Vincente Dr
Length: 0.43 miles
Directions: E-W, N-S, SE-NW, SW-NE
Address range: 1900 to 2099
Directions: E-W, N-S, SE-NW, SW-NE
Address range: 1900 to 2099
Santa Rita Dr
Length: 0.32 miles
Directions: E-W, SW-NE
Address range: 3700 to 3899
Directions: E-W, SW-NE
Address range: 3700 to 3899
Willow Pass Rd
Length: 0.22 miles
Direction: SW-NE
Address range: 3789 to 3899
Direction: SW-NE
Address range: 3789 to 3899
Paloverde Dr
Length: 0.16 miles
Direction: SE-NW
Address range: 1900 to 1999
Direction: SE-NW
Address range: 1900 to 1999
Natoma Dr
Length: 0.12 miles
Directions: E-W, SE-NW
Address range: 1900 to 1999
Directions: E-W, SE-NW
Address range: 1900 to 1999
San Vincente Ct
Length: 0.04 miles
Direction: E-W
Address range: 1900 to 1999
Direction: E-W
Address range: 1900 to 1999
Las Lomas Ct
Length: 0.02 miles
Direction: SE-NW
Address range: 2000 to 2099
Direction: SE-NW
Address range: 2000 to 2099