San Joaquin Marsh neighborhood in Irvine, California (CA), 92612 detailed profile
Settings
X


Business Search - 14 Million verified businesses
Area: 0.649 square miles
Population: 617
Population density:
| San Joaquin Marsh: | 950 people per square mile |
| Irvine: | 6,793 people per square mile |

- 32538.8%White
- 17721.1%Asian
- 14817.7%Hispanic or Latino
- 11313.5%Some other race
- 627.4%Two or more races
- 131.6%Black

Median household income in 2022:
| San Joaquin Marsh: | $65,818 |
| Irvine: | $123,003 |
Distribution of median household income
![Distribution of median household income]()
- 9Less than $10,000
- 113$10,000 to $19,999
- 147$20,000 to $29,999
- 67$30,000 to $39,999
- 11$40,000 to $49,999
- 26$50,000 to $59,999
- 35$60,000 to $74,999
- 24$75,000 to $99,999
- 25$100,000 to $124,999
- 26$125,000 to $149,999
- 17$150,000 to $199,999
- 48$200,000 or more

Distribution of owner-occupied house/condo value
![Distribution of owner-occupied house/condo value]()
- 1Less than $50,000
- 6$100,000 to $149,999
- 7$400,000 to $499,999
- 26$500,000 to $749,999
- 79$750,000 to $999,999
- 29$1,000,000 or more

Distribution of rent paid by renters
![Distribution of rent paid by renters]()
- 59$200 to $299
- 47$400 to $499
- 9$1,000 to $1,249
- 53$1,250 to $1,499
- 47$1,500 to $1,999
- 519$2,000 or more

Median rent in 2022:
| San Joaquin Marsh: | $2,470 |
| Irvine: | $2,001 |
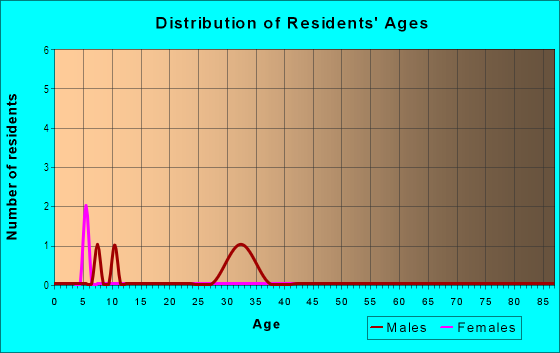
| Males: | 289 |
| Females: | 327 |
Males:
| This neighborhood: | 29.4 years |
| Whole city: | 32.6 years |
| This neighborhood: | 30.2 years |
| Whole city: | 33.9 years |
Average household size:
| San Joaquin Marsh: | 4.6 people |
| Irvine: | 2.6 people |
Percentage of family households:
| San Joaquin Marsh: | 41.4% |
| Irvine: | 53.4% |
| Here: | 42.2% |
| Irvine: | 49.9% |
Percentage of married-couple families with children (among all households):
| San Joaquin Marsh: | 44.4% |
| Irvine: | 28.7% |
Percentage of single-mother households (among all households):
| San Joaquin Marsh: | 18.0% |
| Irvine: | 6.0% |
Percentage of never married males 15 years old and over:
Percentage of never married females 15 years old and over:
| San Joaquin Marsh: | 13.3% |
| Irvine: | 19.8% |
Percentage of never married females 15 years old and over:
| San Joaquin Marsh: | 20.4% |
| city: | 19.0% |
Percentage of people that speak English not well or not at all:
| San Joaquin Marsh: | 9.1% |
| Irvine: | 6.2% |
Percentage of people born in this state:
Percentage of people born in another U.S. state:
Percentage of native residents but born outside the U.S.:
Percentage of foreign born residents:
| Here: | 37.5% |
| Irvine: | 42.7% |
Percentage of people born in another U.S. state:
| San Joaquin Marsh: | 15.7% |
| Irvine: | 16.2% |
Percentage of native residents but born outside the U.S.:
| Here: | 2.9% |
| city: | 1.5% |
Percentage of foreign born residents:
| Here: | 43.8% |
| Irvine: | 39.6% |

Owner-occupied
Renter-occupied


- Rooms in owner-occupied houses and condos in San Joaquin Marsh
- 31 room
- 32 rooms
- 223 rooms
- 354 rooms
- 305 rooms
- 266 rooms
- 327 rooms
- 368 rooms
- 129+ rooms

- Rooms in renter-occupied apartments in San Joaquin Marsh
- 1571 room
- 932 rooms
- 443 rooms
- 624 rooms
- 205 rooms
- 76 rooms
- 27 rooms
- 08 rooms
- 109+ rooms
Owner-occupied
Renter-occupied

- Bedrooms in owner-occupied houses and condos in San Joaquin Marsh
- 3no bedroom
- 101 bedroom
- 852 bedrooms
- 333 bedrooms
- 04 bedrooms
- 05+ bedrooms

- Bedrooms in renter-occupied apartments in San Joaquin Marsh
- 157no bedroom
- 481 bedroom
- 942 bedrooms
- 173 bedrooms
- 04 bedrooms
- 05+ bedrooms
Average number of cars or other vehicles available in houses/condos:
Average number of cars or other vehicles available in apartments:
| This neighborhood: | 1.6 |
| Irvine: | 2.0 |
Average number of cars or other vehicles available in apartments:
| Here: | 1.4 |
| city: | 1.5 |
Percentage of units with a mortgage:
| San Joaquin Marsh: | 41.0% |
| Irvine: | 67.0% |
Housing prices:
- Average estimated value of townhouses or other attached units in 2022 (32.8% of all units):
This neighborhood: $882,819 city: $800,754
- Average estimated '22 value of housing units in 5-or-more-unit structures (26.6% of all units):
San Joaquin Marsh: $952,745 Irvine: $1,006,868

- Year house built in San Joaquin Marsh
- 82020 or later
- 882010 to 2019
- 252000 to 2009
- 371990 to 1999
- 971980 to 1989
- 9171970 to 1979
- 1641960 to 1969
- 31950 to 1959
- 1281940 to 1949
- 101939 or earlier

City-data.com crime index for city in 2020 (higher means more crime):
| City: | 91.9 |
| U.S. average: | 219.5 |
Travel time to work (commute)
![Travel time to work (commute)]()
- 4Less than 5 minutes
- 325 to 9 minutes
- 6610 to 14 minutes
- 5615 to 19 minutes
- 3820 to 24 minutes
- 1625 to 29 minutes
- 1930 to 34 minutes
- 535 to 39 minutes
- 640 to 44 minutes
- 10545 to 59 minutes
- 1260 to 89 minutes
- 290 or more minutes

Means of transportation to work
![Means of transportation to work]()
- 65.7%230Drove a car alone
- 6.0%21Carpooled
- 3.7%13Bus
- 11.7%41Bicycle
- 19.7%69Walked
- 3.7%13Other means
- 22.0%77Worked at home

Time leaving home to go to work
![Time leaving home to go to work]()
- 65:00 a.m. to 5:29 a.m.
- 85:30 a.m. to 5:59 a.m.
- 56:00 a.m. to 6:29 a.m.
- 96:30 a.m. to 6:59 a.m.
- 367:00 a.m. to 7:29 a.m.
- 367:30 a.m. to 7:59 a.m.
- 358:00 a.m. to 8:29 a.m.
- 478:30 a.m. to 8:59 a.m.
- 479:00 a.m. to 9:59 a.m.
- 1210:00 a.m. to 10:59 a.m.
- 311:00 a.m. to 11:59 a.m.
- 1112:00 p.m. to 3:59 p.m.
- 164:00 p.m. to 11:59 p.m.

Occupations of males:
- Percentage of males in management occupations (except farmers):
Here: 23.1% city: 19.7%
- Percentage of males in business and financial operations occupations:
Here: 7.8% city: 9.2%
- Percentage of males in computer and mathematical occupations:
Here: 13.9% city: 14.7%
- Percentage of males in architecture and engineering occupations:
Here: 4.7% city: 9.3%
- Percentage of males in life, physical, and social science occupations:
Here: 2.9% city: 1.6%
- Percentage of males in legal occupations:
Here: 1.1% city: 2.1%
- Percentage of males in education, training, and library occupations:
Here: 4.2% city: 5.0%
- Percentage of males in arts, design, entertainment, sports, and media occupations:
Here: 4.9% city: 3.5%
- Percentage of males in service occupations:
Here: 8.5% city: 7.4%
- Percentage of males in sales and office occupations:
Here: 17.5% city: 15.2%
- Percentage of males in production occupations:
Here: 2.3% city: 1.4%
- Percentage of males in material moving occupations:
Here: 9.1% city: 1.3%
Occupations of females:
- Percentage of females in management occupations (except farmers):
Here: 15.3% city: 11.8%
- Percentage of females in business and financial operations occupations:
Here: 11.8% city: 13.3%
- Percentage of females in architecture and engineering occupations:
Here: 1.0% city: 2.5%
- Percentage of females in life, physical, and social science occupations:
Here: 1.0% city: 2.5%
- Percentage of females in community and social services occupations:
Here: 7.1% city: 2.2%
- Percentage of females in legal occupations:
Here: 2.5% city: 1.8%
- Percentage of females in education, training, and library occupations:
Here: 2.7% city: 10.3%
- Percentage of females in arts, design, entertainment, sports, and media occupations:
Here: 11.6% city: 3.5%
- Percentage of females in healthcare practitioners and technical occupations:
Here: 2.4% city: 10.3%
- Percentage of females in service occupations:
Here: 20.0% city: 10.2%
- Percentage of females in sales and office occupations:
Here: 16.7% city: 23.1%
- Percentage of females in construction, extraction, and maintenance occupations:
Here: 1.0% city: 0.0%
- Percentage of females in production occupations:
Here: 2.8% city: 1.3%
- Percentage of females in transportation occupations:
Here: 2.7% city: 0.5%
Education in this neighborhood (subdivision or community):
- Percentage of people 3 years and older in K-12 schools:
San Joaquin Marsh: 63.8% Irvine: 17.2%
- Percentage of people 3 years and older in undergraduate colleges:
San Joaquin Marsh: 7.7% Irvine: 12.6%
- Percentage of people 3 years and older in grad. or professional schools:
San Joaquin Marsh: 5.2% Irvine: 3.7%
- Percentage of students K-12 enrolled in private schools:
San Joaquin Marsh: 102.6% Irvine: 11.1%
Percentage of population below poverty level:
| San Joaquin Marsh: | 28.8% |
| Irvine: | 11.2% |
Percentage of married-couple families with both working:
| San Joaquin Marsh: | 55.0% |
| Irvine: | 58.4% |

- 59.2%Utility gas
- 35.3%Electricity
- 4.4%No fuel used
- 1.1%Bottled, tank, or LP gas
Roads and streets:
Harvard Ave
Length: 0.11 miles
Direction: N-S
Direction: N-S