Salt Creek neighborhood in Chula Vista, California (CA), 91913, 91914 detailed profile
Settings
X


Business Search - 14 Million verified businesses
Area: 0.183 square miles
Population: 1,560
Population density:
| Salt Creek: | 8,509 people per square mile |
| Chula Vista: | 5,711 people per square mile |

- 75948.7%Hispanic or Latino
- 45829.4%White
- 22114.2%Asian
- 966.2%Two or more races
- 241.5%Black

Median household income in 2022:
| Salt Creek: | $147,100 |
| Chula Vista: | $101,190 |
Distribution of median household income
![Distribution of median household income]()
- 2Less than $10,000
- 11$10,000 to $19,999
- 8$20,000 to $29,999
- 34$30,000 to $39,999
- 24$40,000 to $49,999
- 10$50,000 to $59,999
- 7$60,000 to $74,999
- 15$75,000 to $99,999
- 73$100,000 to $124,999
- 77$125,000 to $149,999
- 106$150,000 to $199,999
- 130$200,000 or more

Distribution of owner-occupied house/condo value
![Distribution of owner-occupied house/condo value]()
- 5Less than $50,000
- 2$50,000 to $99,999
- 129$500,000 to $749,999
- 221$750,000 to $999,999
- 76$1,000,000 or more

Distribution of rent paid by renters
![Distribution of rent paid by renters]()
- 52$2,000 or more

Median rent in 2022:
| Salt Creek: | $3,307 |
| Chula Vista: | $1,879 |
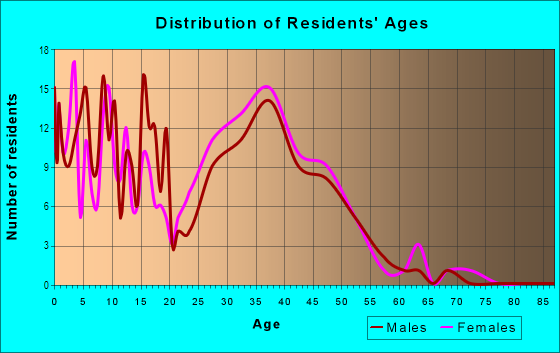
| Males: | 765 |
| Females: | 794 |
Males:
| This neighborhood: | 42.5 years |
| Whole city: | 34.8 years |
| This neighborhood: | 41.0 years |
| Whole city: | 37.4 years |
Average household size:
| Salt Creek: | 3.2 people |
| Chula Vista: | 3.2 people |
Percentage of family households:
| Salt Creek: | 62.1% |
| Chula Vista: | 57.2% |
| Here: | 71.8% |
| Chula Vista: | 54.5% |
Percentage of married-couple families with children (among all households):
| Salt Creek: | 24.9% |
| Chula Vista: | 22.9% |
Percentage of single-mother households (among all households):
| Salt Creek: | 5.0% |
| Chula Vista: | 5.5% |
Percentage of never married males 15 years old and over:
Percentage of never married females 15 years old and over:
| Salt Creek: | 12.8% |
| Chula Vista: | 19.8% |
Percentage of never married females 15 years old and over:
| Salt Creek: | 10.2% |
| city: | 16.5% |
Percentage of people that speak English not well or not at all:
| Salt Creek: | 2.9% |
| Chula Vista: | 8.7% |
Percentage of people born in this state:
Percentage of people born in another U.S. state:
Percentage of native residents but born outside the U.S.:
Percentage of foreign born residents:
| Here: | 53.4% |
| Chula Vista: | 56.5% |
Percentage of people born in another U.S. state:
| Salt Creek: | 19.9% |
| Chula Vista: | 13.1% |
Percentage of native residents but born outside the U.S.:
| Here: | 4.0% |
| city: | 2.8% |
Percentage of foreign born residents:
| Here: | 22.7% |
| Chula Vista: | 27.6% |

Owner-occupied
Renter-occupied


- Rooms in owner-occupied houses and condos in Salt Creek
- 01 room
- 02 rooms
- 03 rooms
- 174 rooms
- 525 rooms
- 676 rooms
- 877 rooms
- 1098 rooms
- 959+ rooms

- Rooms in renter-occupied apartments in Salt Creek
- 01 room
- 02 rooms
- 03 rooms
- 04 rooms
- 75 rooms
- 106 rooms
- 247 rooms
- 178 rooms
- 09+ rooms
Owner-occupied
Renter-occupied

- Bedrooms in owner-occupied houses and condos in Salt Creek
- 0no bedroom
- 01 bedroom
- 02 bedrooms
- 2103 bedrooms
- 1634 bedrooms
- 565+ bedrooms

- Bedrooms in renter-occupied apartments in Salt Creek
- 0no bedroom
- 01 bedroom
- 02 bedrooms
- 73 bedrooms
- 364 bedrooms
- 165+ bedrooms
Average number of cars or other vehicles available in houses/condos:
Average number of cars or other vehicles available in apartments:
| This neighborhood: | 2.5 |
| Chula Vista: | 2.4 |
Average number of cars or other vehicles available in apartments:
| Here: | 2.6 |
| city: | 1.7 |
Percentage of units with a mortgage:
| Salt Creek: | 80.8% |
| Chula Vista: | 76.0% |
Average estimated value of detached houses in 2022 (100.0% of all units):
| Salt Creek: | $819,259 |
| California: | $988,808 |

- Year house built in Salt Creek
- 02020 or later
- 42010 to 2019
- 02000 to 2009
- 1601990 to 1999
- 3431980 to 1989
- 01970 to 1979
- 01960 to 1969
- 71950 to 1959
- 01940 to 1949
- 01939 or earlier

City-data.com crime index for city in 2020 (higher means more crime):
| City: | 159.8 |
| U.S. average: | 219.5 |
Travel time to work (commute)
![Travel time to work (commute)]()
- 605 to 9 minutes
- 4310 to 14 minutes
- 8615 to 19 minutes
- 3920 to 24 minutes
- 1425 to 29 minutes
- 14130 to 34 minutes
- 2035 to 39 minutes
- 3840 to 44 minutes
- 5445 to 59 minutes
- 4560 to 89 minutes

Means of transportation to work
![Means of transportation to work]()
- 68.4%460Drove a car alone
- 8.5%57Carpooled
- 0.9%6Bus
- 0.1%1Walked
- 2.5%17Other means
- 19.2%129Worked at home

Time leaving home to go to work
![Time leaving home to go to work]()
- 3512:00 a.m. to 4:59 a.m.
- 515:00 a.m. to 5:29 a.m.
- 405:30 a.m. to 5:59 a.m.
- 606:00 a.m. to 6:29 a.m.
- 246:30 a.m. to 6:59 a.m.
- 887:00 a.m. to 7:29 a.m.
- 547:30 a.m. to 7:59 a.m.
- 368:00 a.m. to 8:29 a.m.
- 488:30 a.m. to 8:59 a.m.
- 249:00 a.m. to 9:59 a.m.
- 810:00 a.m. to 10:59 a.m.
- 3212:00 p.m. to 3:59 p.m.
- 374:00 p.m. to 11:59 p.m.

Occupations of males:
- Percentage of males in management occupations (except farmers):
Here: 27.9% city: 9.9%
- Percentage of males in business and financial operations occupations:
Here: 5.3% city: 6.5%
- Percentage of males in computer and mathematical occupations:
Here: 5.9% city: 4.9%
- Percentage of males in architecture and engineering occupations:
Here: 2.3% city: 4.8%
- Percentage of males in life, physical, and social science occupations:
Here: 1.9% city: 1.2%
- Percentage of males in community and social services occupations:
Here: 1.1% city: 1.2%
- Percentage of males in education, training, and library occupations:
Here: 8.2% city: 2.3%
- Percentage of males in arts, design, entertainment, sports, and media occupations:
Here: 4.4% city: 1.8%
- Percentage of males in healthcare practitioners and technical occupations:
Here: 9.5% city: 3.0%
- Percentage of males in service occupations:
Here: 5.7% city: 18.4%
- Percentage of males in sales and office occupations:
Here: 13.9% city: 16.0%
- Percentage of males in production occupations:
Here: 3.6% city: 5.7%
- Percentage of males in transportation occupations:
Here: 5.7% city: 5.1%
- Percentage of males in material moving occupations:
Here: 1.5% city: 3.7%
Occupations of females:
- Percentage of females in management occupations (except farmers):
Here: 6.2% city: 8.6%
- Percentage of females in business and financial operations occupations:
Here: 6.0% city: 5.6%
- Percentage of females in computer and mathematical occupations:
Here: 1.8% city: 1.2%
- Percentage of females in architecture and engineering occupations:
Here: 2.3% city: 1.0%
- Percentage of females in community and social services occupations:
Here: 4.9% city: 3.1%
- Percentage of females in legal occupations:
Here: 1.8% city: 1.1%
- Percentage of females in education, training, and library occupations:
Here: 14.1% city: 7.6%
- Percentage of females in healthcare practitioners and technical occupations:
Here: 7.6% city: 10.6%
- Percentage of females in service occupations:
Here: 14.1% city: 22.6%
- Percentage of females in sales and office occupations:
Here: 32.8% city: 29.5%
- Percentage of females in production occupations:
Here: 8.3% city: 3.0%
Education in this neighborhood (subdivision or community):
- Percentage of people 3 years and older in K-12 schools:
Salt Creek: 20.0% Chula Vista: 22.0%
- Percentage of people 3 years and older in undergraduate colleges:
Salt Creek: 10.6% Chula Vista: 7.6%
- Percentage of people 3 years and older in grad. or professional schools:
Salt Creek: 1.7% Chula Vista: 1.2%
- Percentage of students K-12 enrolled in private schools:
Salt Creek: 20.2% Chula Vista: 7.0%
Percentage of population below poverty level:
| Salt Creek: | 4.1% |
| Chula Vista: | 10.1% |
Median year owner moved in (as recorded in 2022):
Median year renter moved in (as recorded in 2022):
| Salt Creek: | 2004 |
| Chula Vista: | 2011 |
Median year renter moved in (as recorded in 2022):
| Salt Creek: | 2012 |
| Chula Vista: | 2018 |
Percentage of married-couple families with both working:
| Salt Creek: | 46.6% |
| Chula Vista: | 69.2% |

- 75.0%Utility gas
- 21.7%Electricity
- 1.7%Solar energy
- 1.7%No fuel used
Roads and streets:
Cabo Bahia
Length: 0.75 miles
Directions: E-W, N-S, SE-NW, SW-NE
Address range: 2143 to 2236
Directions: E-W, N-S, SE-NW, SW-NE
Address range: 2143 to 2236
Lago Ventana
Length: 0.69 miles
Directions: E-W, N-S, SE-NW, SW-NE
Address range: 2100 to 2399
Directions: E-W, N-S, SE-NW, SW-NE
Address range: 2100 to 2399
Mt Miguel Rd
Length: 0.47 miles
Directions: E-W, N-S
Address range: 500 to 3665
Directions: E-W, N-S
Address range: 500 to 3665
Rolling Ridge Rd
Length: 0.45 miles
Directions: E-W, N-S, SE-NW, SW-NE
Address range: 2210 to 2399
Directions: E-W, N-S, SE-NW, SW-NE
Address range: 2210 to 2399
Mountain Ridge Rd
Length: 0.31 miles
Directions: E-W, N-S, SE-NW
Address range: 2200 to 2299
Directions: E-W, N-S, SE-NW
Address range: 2200 to 2299
Riverbend Way
Length: 0.11 miles
Directions: E-W, N-S, SW-NE
Address range: 500 to 599
Directions: E-W, N-S, SW-NE
Address range: 500 to 599
Windy Way
Length: 0.11 miles
Directions: E-W, N-S, SW-NE
Address range: 500 to 599
Directions: E-W, N-S, SW-NE
Address range: 500 to 599
Ocean Breeze Way
Length: 0.11 miles
Direction: N-S
Address range: 500 to 599
Direction: N-S
Address range: 500 to 599
Ocean View Ln
Length: 0.08 miles
Directions: E-W, N-S
Address range: 500 to 599
Directions: E-W, N-S
Address range: 500 to 599
Rivercreek Ct
Length: 0.08 miles
Directions: E-W, N-S
Address range: 400 to 499
Directions: E-W, N-S
Address range: 400 to 499
Lago Madero
Length: 0.05 miles
Direction: E-W
Address range: 2100 to 2299
Direction: E-W
Address range: 2100 to 2299
Sea Breeze Ct
Length: 0.04 miles
Directions: E-W, N-S, SE-NW
Address range: 2100 to 2199
Directions: E-W, N-S, SE-NW
Address range: 2100 to 2199