Rockaway neighborhood in Pacifica, California (CA), 94044 detailed profile
Settings
X


Business Search - 14 Million verified businesses
Area: 0.687 square miles
Population: 1,140
Population density:
| Rockaway: | 1,659 people per square mile |
| Pacifica: | 3,012 people per square mile |

- 70660.8%White
- 21618.6%Hispanic or Latino
- 12410.7%Asian
- 544.7%Two or more races
- 232.0%Black
- 211.8%Native Hawaiian and Other
Pacific Islander - 171.5%Some other race

Distribution of median household income
![Distribution of median household income]()
- 33Less than $10,000
- 10$10,000 to $19,999
- 20$20,000 to $29,999
- 20$30,000 to $39,999
- 35$40,000 to $49,999
- 8$50,000 to $59,999
- 21$60,000 to $74,999
- 29$75,000 to $99,999
- 11$100,000 to $124,999
- 14$125,000 to $149,999
- 85$150,000 to $199,999
- 175$200,000 or more

Distribution of owner-occupied house/condo value
![Distribution of owner-occupied house/condo value]()
- 38Less than $50,000
- 4$100,000 to $149,999
- 1$200,000 to $249,999
- 6$300,000 to $399,999
- 5$400,000 to $499,999
- 35$500,000 to $749,999
- 74$750,000 to $999,999
- 244$1,000,000 or more

Distribution of rent paid by renters
![Distribution of rent paid by renters]()
- 89$100 to $199
- 17$300 to $399
- 14$500 to $599
- 12$600 to $699
- 2$800 to $899
- 14$1,000 to $1,249
- 4$1,250 to $1,499
- 6$1,500 to $1,999
- 39$2,000 or more

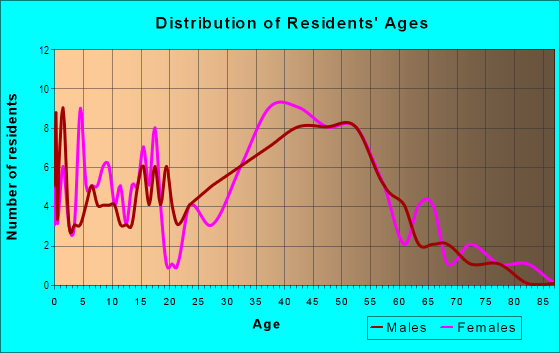
| Males: | 511 |
| Females: | 629 |
Males:
| This neighborhood: | 43.9 years |
| Whole city: | 42.2 years |
| This neighborhood: | 50.1 years |
| Whole city: | 44.6 years |
Average household size:
| Rockaway: | 9.3 people |
| Pacifica: | 2.7 people |
Percentage of family households:
| Rockaway: | 53.8% |
| Pacifica: | 45.8% |
| Here: | 65.8% |
| Pacifica: | 55.6% |
Percentage of married-couple families with children (among all households):
| Rockaway: | 31.8% |
| Pacifica: | 30.5% |
Percentage of single-mother households (among all households):
| Rockaway: | 1.6% |
| Pacifica: | 4.0% |
Percentage of never married males 15 years old and over:
Percentage of never married females 15 years old and over:
| Rockaway: | 11.5% |
| Pacifica: | 18.0% |
Percentage of never married females 15 years old and over:
| Rockaway: | 17.7% |
| city: | 13.5% |
Percentage of people that speak English not well or not at all:
| Rockaway: | 0.9% |
| Pacifica: | 2.3% |
Percentage of people born in this state:
Percentage of people born in another U.S. state:
Percentage of native residents but born outside the U.S.:
Percentage of foreign born residents:
| Here: | 60.5% |
| Pacifica: | 58.3% |
Percentage of people born in another U.S. state:
| Rockaway: | 18.5% |
| Pacifica: | 17.9% |
Percentage of native residents but born outside the U.S.:
| Here: | 2.0% |
| city: | 1.9% |
Percentage of foreign born residents:
| Here: | 19.0% |
| Pacifica: | 21.9% |

Owner-occupied
Renter-occupied


- Rooms in owner-occupied houses and condos in Rockaway
- 11 room
- 32 rooms
- 13 rooms
- 264 rooms
- 865 rooms
- 1136 rooms
- 437 rooms
- 358 rooms
- 429+ rooms

- Rooms in renter-occupied apartments in Rockaway
- 31 room
- 322 rooms
- 223 rooms
- 164 rooms
- 65 rooms
- 56 rooms
- 3577 rooms
- 08 rooms
- 99+ rooms
Owner-occupied
Renter-occupied

- Bedrooms in owner-occupied houses and condos in Rockaway
- 1no bedroom
- 41 bedroom
- 452 bedrooms
- 1983 bedrooms
- 734 bedrooms
- 305+ bedrooms

- Bedrooms in renter-occupied apartments in Rockaway
- 3no bedroom
- 251 bedroom
- 42 bedrooms
- 103 bedrooms
- 54 bedrooms
- 95+ bedrooms
Average number of cars or other vehicles available in houses/condos:
Average number of cars or other vehicles available in apartments:
| This neighborhood: | 2.6 |
| Pacifica: | 2.4 |
Average number of cars or other vehicles available in apartments:
| Here: | 1.4 |
| city: | 1.7 |
Percentage of units with a mortgage:
| Rockaway: | 64.8% |
| Pacifica: | 69.8% |
Housing prices:
- Average estimated value of detached houses in 2022 (90.9% of all units):
Rockaway: $1,265,853 California: $988,808
- Average estimated value of townhouses or other attached units in 2022 (4.9% of all units):
This neighborhood: $832,917 California: $838,546

- Year house built in Rockaway
- 02020 or later
- 02010 to 2019
- 82000 to 2009
- 121990 to 1999
- 561980 to 1989
- 911970 to 1979
- 991960 to 1969
- 1271950 to 1959
- 131940 to 1949
- 111939 or earlier

City-data.com crime index for city in 2020 (higher means more crime):
| City: | 150.9 |
| U.S. average: | 219.5 |
Travel time to work (commute)
![Travel time to work (commute)]()
- 7Less than 5 minutes
- 565 to 9 minutes
- 3810 to 14 minutes
- 3115 to 19 minutes
- 7520 to 24 minutes
- 1825 to 29 minutes
- 8630 to 34 minutes
- 1035 to 39 minutes
- 2640 to 44 minutes
- 7345 to 59 minutes
- 3760 to 89 minutes
- 490 or more minutes

Means of transportation to work
![Means of transportation to work]()
- 70.8%412Drove a car alone
- 4.3%25Carpooled
- 0.9%5Bus
- 4.6%27Subway or elevated rail
- 2.7%16Long-distance train or commuter rail
- 4.3%25Taxi
- 1.4%8Motorcycle
- 0.2%1Bicycle
- 2.2%13Walked
- 0.2%1Other means
- 16.7%97Worked at home

Time leaving home to go to work
![Time leaving home to go to work]()
- 1612:00 a.m. to 4:59 a.m.
- 65:00 a.m. to 5:29 a.m.
- 115:30 a.m. to 5:59 a.m.
- 576:00 a.m. to 6:29 a.m.
- 446:30 a.m. to 6:59 a.m.
- 507:00 a.m. to 7:29 a.m.
- 477:30 a.m. to 7:59 a.m.
- 568:00 a.m. to 8:29 a.m.
- 368:30 a.m. to 8:59 a.m.
- 379:00 a.m. to 9:59 a.m.
- 3110:00 a.m. to 10:59 a.m.
- 711:00 a.m. to 11:59 a.m.
- 2112:00 p.m. to 3:59 p.m.
- 194:00 p.m. to 11:59 p.m.

Occupations of males:
- Percentage of males in management occupations (except farmers):
Here: 20.8% city: 14.5%
- Percentage of males in business and financial operations occupations:
Here: 6.1% city: 5.0%
- Percentage of males in computer and mathematical occupations:
Here: 9.6% city: 8.8%
- Percentage of males in architecture and engineering occupations:
Here: 4.0% city: 4.6%
- Percentage of males in life, physical, and social science occupations:
Here: 5.7% city: 2.5%
- Percentage of males in education, training, and library occupations:
Here: 10.9% city: 3.6%
- Percentage of males in arts, design, entertainment, sports, and media occupations:
Here: 3.0% city: 3.3%
- Percentage of males in healthcare practitioners and technical occupations:
Here: 4.0% city: 3.5%
- Percentage of males in service occupations:
Here: 7.3% city: 12.5%
- Percentage of males in sales and office occupations:
Here: 12.4% city: 14.8%
- Percentage of males in construction, extraction, and maintenance occupations:
Here: 4.3% city: 7.7%
- Percentage of males in production occupations:
Here: 4.5% city: 4.4%
- Percentage of males in transportation occupations:
Here: 1.9% city: 8.0%
Occupations of females:
- Percentage of females in management occupations (except farmers):
Here: 18.1% city: 13.8%
- Percentage of females in business and financial operations occupations:
Here: 1.8% city: 7.1%
- Percentage of females in computer and mathematical occupations:
Here: 1.3% city: 1.5%
- Percentage of females in architecture and engineering occupations:
Here: 5.9% city: 2.1%
- Percentage of females in life, physical, and social science occupations:
Here: 5.5% city: 3.8%
- Percentage of females in education, training, and library occupations:
Here: 21.6% city: 10.7%
- Percentage of females in arts, design, entertainment, sports, and media occupations:
Here: 5.3% city: 4.6%
- Percentage of females in healthcare practitioners and technical occupations:
Here: 2.5% city: 10.8%
- Percentage of females in service occupations:
Here: 14.9% city: 15.1%
- Percentage of females in sales and office occupations:
Here: 16.0% city: 21.8%
- Percentage of females in material moving occupations:
Here: 3.5% city: 1.1%
Education in this neighborhood (subdivision or community):
- Percentage of people 3 years and older in K-12 schools:
Rockaway: 17.7% Pacifica: 14.7%
- Percentage of people 3 years and older in undergraduate colleges:
Rockaway: 5.3% Pacifica: 5.6%
- Percentage of people 3 years and older in grad. or professional schools:
Rockaway: 3.1% Pacifica: 1.1%
- Percentage of students K-12 enrolled in private schools:
Rockaway: 36.1% Pacifica: 16.2%
Percentage of population below poverty level:
| Rockaway: | 4.9% |
| Pacifica: | 5.6% |
Median year owner moved in (as recorded in 2022):
| Rockaway: | 2001 |
| Pacifica: | 2002 |
Percentage of married-couple families with both working:
| Rockaway: | 83.7% |
| Pacifica: | 76.9% |

- 72.7%Utility gas
- 12.9%Electricity
- 9.2%No fuel used
- 2.5%Solar energy
- 1.7%Wood
- 1.1%Bottled, tank, or LP gas
Highways in this neighborhood:
Cabrillo Hwy (Coast Hwy, State Hwy 1)
Length: 0.39 miles
Direction: SW-NE
Address range: 4200 to 4799
Direction: SW-NE
Address range: 4200 to 4799
Roads and streets:
Fassler Ave
Length: 1.44 miles
Directions: E-W, N-S, SE-NW, SW-NE
Address range: 700 to 1170
Directions: E-W, N-S, SE-NW, SW-NE
Address range: 700 to 1170
Rockaway Beach Ave
Length: 1.01 miles
Directions: E-W, SE-NW
Address range: 100 to 6133
Directions: E-W, SE-NW
Address range: 100 to 6133
Sweeney Ridge Trl
Length: 0.53 miles
Direction: SW-NE
Direction: SW-NE
San Marlo Way
Length: 0.29 miles
Directions: E-W, SW-NE
Address range: 650 to 899
Directions: E-W, SW-NE
Address range: 650 to 899
Donaldson Ave
Length: 0.25 miles
Directions: E-W, N-S, SW-NE
Address range: 300 to 499
Directions: E-W, N-S, SW-NE
Address range: 300 to 499
Buel Ave
Length: 0.23 miles
Directions: N-S, SE-NW, SW-NE
Address range: 400 to 599
Directions: N-S, SE-NW, SW-NE
Address range: 400 to 599
Copeland St
Length: 0.19 miles
Directions: E-W, SE-NW
Address range: 400 to 499
Directions: E-W, SE-NW
Address range: 400 to 499
Ebken St
Length: 0.15 miles
Directions: E-W, SE-NW
Address range: 300 to 599
Directions: E-W, SE-NW
Address range: 300 to 599
San Marlo Way (Maitland Rd)
Length: 0.15 miles
Directions: SE-NW, SW-NE
Address range: 400 to 649
Directions: SE-NW, SW-NE
Address range: 400 to 649
Harvey Way
Length: 0.13 miles
Directions: SE-NW, SW-NE
Address range: 421 to 449
Directions: SE-NW, SW-NE
Address range: 421 to 449
Calera Ter
Length: 0.13 miles
Directions: E-W, SE-NW, SW-NE
Address range: 800 to 899
Directions: E-W, SE-NW, SW-NE
Address range: 800 to 899
Old Country Rd
Length: 0.12 miles
Direction: SW-NE
Address range: 416 to 499
Direction: SW-NE
Address range: 416 to 499
Troglia Ter
Length: 0.11 miles
Direction: N-S
Address range: 100 to 299
Direction: N-S
Address range: 100 to 299
Dondee St (Dondee Way)
Length: 0.11 miles
Direction: SW-NE
Address range: 437 to 499
Direction: SW-NE
Address range: 437 to 499
Bayview Rd
Length: 0.08 miles
Direction: SW-NE
Address range: 100 to 175
Direction: SW-NE
Address range: 100 to 175
Nick Gust Way
Length: 0.07 miles
Direction: SW-NE
Address range: 400 to 599
Direction: SW-NE
Address range: 400 to 599
Old County Rd
Length: 0.06 miles
Direction: SE-NW
Direction: SE-NW
Spring St
Length: 0.05 miles
Direction: SW-NE
Address range: 1 to 99
Direction: SW-NE
Address range: 1 to 99
Pilar Pl
Length: 0.05 miles
Directions: E-W, SE-NW
Address range: 900 to 999
Directions: E-W, SE-NW
Address range: 900 to 999
Bay View Rd
Length: 0.04 miles
Direction: SW-NE
Direction: SW-NE
Estella Dr
Length: 0.03 miles
Directions: N-S, SW-NE
Directions: N-S, SW-NE
Harvey Ln
Length: 0.03 miles
Directions: E-W, SW-NE
Address range: 423 to 429
Directions: E-W, SW-NE
Address range: 423 to 429
Oddstad Way
Length: 0.02 miles
Direction: E-W
Direction: E-W
Other features:
Calara Crk
Length: 0.25 miles
Directions: E-W, SW-NE
Directions: E-W, SW-NE