Rock Island neighborhood in Quincy, Massachusetts (MA), 02169 detailed profile
Settings
X


Business Search - 14 Million verified businesses
Area: 0.138 square miles
Population: 482
Population density:
| Rock Island: | 3,493 people per square mile |
| Quincy: | 6,060 people per square mile |

- 32962.7%White
- 8816.8%Asian
- 438.2%Two or more races
- 326.1%Black
- 203.8%Hispanic or Latino
- 132.5%Some other race

Median household income in 2022:
| Rock Island: | $68,466 |
| Quincy: | $90,205 |
Distribution of median household income
![Distribution of median household income]()
- 20Less than $10,000
- 27$10,000 to $19,999
- 10$20,000 to $29,999
- 10$30,000 to $39,999
- 21$40,000 to $49,999
- 14$50,000 to $59,999
- 28$60,000 to $74,999
- 21$75,000 to $99,999
- 23$100,000 to $124,999
- 12$125,000 to $149,999
- 13$150,000 to $199,999
- 32$200,000 or more

Distribution of owner-occupied house/condo value
![Distribution of owner-occupied house/condo value]()
- 17Less than $50,000
- 19$50,000 to $99,999
- 2$150,000 to $199,999
- 4$200,000 to $249,999
- 3$250,000 to $299,999
- 24$300,000 to $399,999
- 64$400,000 to $499,999
- 46$500,000 to $749,999
- 14$750,000 to $999,999
- 9$1,000,000 or more

Distribution of rent paid by renters
![Distribution of rent paid by renters]()
- 13Less than $100
- 12$100 to $199
- 6$200 to $299
- 15$300 to $399
- 18$400 to $499
- 11$500 to $599
- 8$600 to $699
- 3$700 to $799
- 7$800 to $899
- 7$900 to $999
- 8$1,000 to $1,249
- 5$1,250 to $1,499
- 4$1,500 to $1,999
- 8$2,000 or more

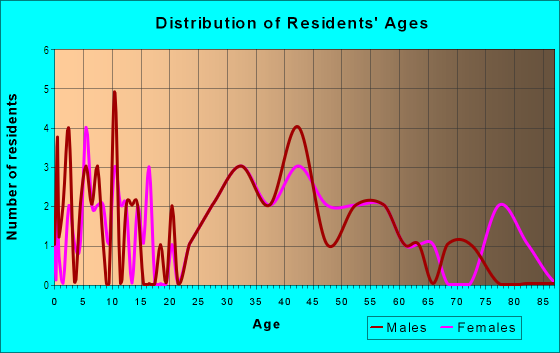
| Males: | 247 |
| Females: | 234 |
Males:
| This neighborhood: | 37.5 years |
| Whole city: | 37.6 years |
| This neighborhood: | 45.1 years |
| Whole city: | 43.7 years |
Average household size:
| Rock Island: | 2.6 people |
| Quincy: | 2.1 people |
Percentage of family households:
| Rock Island: | 59.3% |
| Quincy: | 36.2% |
| Here: | 63.0% |
| Quincy: | 39.5% |
Percentage of married-couple families with children (among all households):
| Rock Island: | 27.6% |
| Quincy: | 35.4% |
Percentage of single-mother households (among all households):
| Rock Island: | 28.4% |
| Quincy: | 7.9% |
Percentage of never married males 15 years old and over:
Percentage of never married females 15 years old and over:
| Rock Island: | 17.1% |
| Quincy: | 20.7% |
Percentage of never married females 15 years old and over:
| Rock Island: | 10.0% |
| city: | 17.4% |
Percentage of people that speak English not well or not at all:
| Rock Island: | 11.0% |
| Quincy: | 10.5% |
Percentage of people born in this state:
Percentage of people born in another U.S. state:
Percentage of native residents but born outside the U.S.:
Percentage of foreign born residents:
| Here: | 63.6% |
| Quincy: | 49.7% |
Percentage of people born in another U.S. state:
| Rock Island: | 11.1% |
| Quincy: | 13.3% |
Percentage of native residents but born outside the U.S.:
| Here: | 1.3% |
| city: | 1.6% |
Percentage of foreign born residents:
| Here: | 24.0% |
| Quincy: | 35.4% |

Owner-occupied
Renter-occupied


- Rooms in owner-occupied houses and condos in Rock Island
- 01 room
- 02 rooms
- 73 rooms
- 484 rooms
- 265 rooms
- 356 rooms
- 267 rooms
- 308 rooms
- 209+ rooms

- Rooms in renter-occupied apartments in Rock Island
- 21 room
- 12 rooms
- 133 rooms
- 494 rooms
- 65 rooms
- 26 rooms
- 07 rooms
- 48 rooms
- 09+ rooms
Owner-occupied
Renter-occupied

- Bedrooms in owner-occupied houses and condos in Rock Island
- 0no bedroom
- 61 bedroom
- 552 bedrooms
- 703 bedrooms
- 234 bedrooms
- 55+ bedrooms

- Bedrooms in renter-occupied apartments in Rock Island
- 2no bedroom
- 81 bedroom
- 232 bedrooms
- 203 bedrooms
- 54 bedrooms
- 05+ bedrooms
Average number of cars or other vehicles available in houses/condos:
Average number of cars or other vehicles available in apartments:
| This neighborhood: | 1.4 |
| Quincy: | 1.6 |
Average number of cars or other vehicles available in apartments:
| Here: | 1.5 |
| city: | 1.0 |
Percentage of units with a mortgage:
| Rock Island: | 74.0% |
| Quincy: | 62.1% |

- Year house built in Rock Island
- 02020 or later
- 82010 to 2019
- 82000 to 2009
- 91990 to 1999
- 161980 to 1989
- 61970 to 1979
- 201960 to 1969
- 261950 to 1959
- 271940 to 1949
- 941939 or earlier

City-data.com crime index for city in 2020 (higher means more crime):
| City: | 146.2 |
| U.S. average: | 219.5 |
Travel time to work (commute)
![Travel time to work (commute)]()
- 2Less than 5 minutes
- 25 to 9 minutes
- 810 to 14 minutes
- 1715 to 19 minutes
- 1920 to 24 minutes
- 1025 to 29 minutes
- 2230 to 34 minutes
- 735 to 39 minutes
- 1640 to 44 minutes
- 1345 to 59 minutes
- 2460 to 89 minutes
- 1190 or more minutes

Means of transportation to work
![Means of transportation to work]()
- 67.1%154Drove a car alone
- 3.9%9Carpooled
- 2.6%6Bus
- 9.1%21Subway or elevated rail
- 0.9%2Long-distance train or commuter rail
- 0.4%1Motorcycle
- 1.3%3Bicycle
- 4.4%10Walked
- 10.5%24Other means
- 12.2%28Worked at home

Time leaving home to go to work
![Time leaving home to go to work]()
- 412:00 a.m. to 4:59 a.m.
- 85:00 a.m. to 5:29 a.m.
- 55:30 a.m. to 5:59 a.m.
- 276:00 a.m. to 6:29 a.m.
- 126:30 a.m. to 6:59 a.m.
- 97:00 a.m. to 7:29 a.m.
- 167:30 a.m. to 7:59 a.m.
- 188:00 a.m. to 8:29 a.m.
- 88:30 a.m. to 8:59 a.m.
- 169:00 a.m. to 9:59 a.m.
- 110:00 a.m. to 10:59 a.m.
- 411:00 a.m. to 11:59 a.m.
- 1712:00 p.m. to 3:59 p.m.
- 124:00 p.m. to 11:59 p.m.

Occupations of males:
- Percentage of males in management occupations (except farmers):
Here: 14.5% city: 12.6%
- Percentage of males in business and financial operations occupations:
Here: 7.5% city: 8.0%
- Percentage of males in computer and mathematical occupations:
Here: 5.4% city: 10.4%
- Percentage of males in life, physical, and social science occupations:
Here: 2.9% city: 2.1%
- Percentage of males in legal occupations:
Here: 1.6% city: 2.2%
- Percentage of males in education, training, and library occupations:
Here: 7.3% city: 2.8%
- Percentage of males in healthcare practitioners and technical occupations:
Here: 2.0% city: 3.3%
- Percentage of males in service occupations:
Here: 19.9% city: 15.2%
- Percentage of males in sales and office occupations:
Here: 17.9% city: 16.0%
- Percentage of males in construction, extraction, and maintenance occupations:
Here: 13.4% city: 5.1%
- Percentage of males in transportation occupations:
Here: 2.8% city: 4.9%
- Percentage of males in material moving occupations:
Here: 4.6% city: 4.1%
Occupations of females:
- Percentage of females in management occupations (except farmers):
Here: 29.5% city: 11.4%
- Percentage of females in business and financial operations occupations:
Here: 9.0% city: 11.1%
- Percentage of females in life, physical, and social science occupations:
Here: 2.4% city: 1.8%
- Percentage of females in community and social services occupations:
Here: 3.9% city: 2.2%
- Percentage of females in legal occupations:
Here: 2.1% city: 1.4%
- Percentage of females in education, training, and library occupations:
Here: 7.2% city: 9.1%
- Percentage of females in healthcare practitioners and technical occupations:
Here: 6.7% city: 9.7%
- Percentage of females in service occupations:
Here: 15.1% city: 19.9%
- Percentage of females in sales and office occupations:
Here: 19.7% city: 22.1%
- Percentage of females in construction, extraction, and maintenance occupations:
Here: 1.0% city: 0.2%
- Percentage of females in production occupations:
Here: 1.7% city: 1.5%
- Percentage of females in transportation occupations:
Here: 1.1% city: 0.4%
Education in this neighborhood (subdivision or community):
- Percentage of people 3 years and older in K-12 schools:
Rock Island: 28.7% Quincy: 11.7%
- Percentage of people 3 years and older in undergraduate colleges:
Rock Island: 2.1% Quincy: 6.1%
- Percentage of people 3 years and older in grad. or professional schools:
Rock Island: 2.5% Quincy: 3.6%
- Percentage of students K-12 enrolled in private schools:
Rock Island: 5.8% Quincy: 10.2%
Percentage of population below poverty level:
| Rock Island: | 23.2% |
| Quincy: | 12.1% |
Median year owner moved in (as recorded in 2022):
| Rock Island: | 1998 |
| Quincy: | 2009 |
Percentage of married-couple families with both working:
| Rock Island: | 81.2% |
| Quincy: | 63.7% |

- 68.6%Utility gas
- 14.3%Fuel oil, kerosene, etc.
- 6.7%Electricity
- 4.8%Other fuel
- 3.6%Bottled, tank, or LP gas
- 2.0%No fuel used
Roads and streets:
Rhoda St
Length: 0.57 miles
Directions: E-W, SE-NW
Address range: 32 to 299
Directions: E-W, SE-NW
Address range: 32 to 299
Allerton St
Length: 0.25 miles
Direction: SE-NW
Address range: 1 to 99
Direction: SE-NW
Address range: 1 to 99
Camden St
Length: 0.22 miles
Direction: SW-NE
Address range: 13 to 99
Direction: SW-NE
Address range: 13 to 99
Rockland St
Length: 0.17 miles
Direction: SW-NE
Address range: 85 to 199
Direction: SW-NE
Address range: 85 to 199
Pawsey St
Length: 0.16 miles
Directions: SE-NW, SW-NE
Address range: 1 to 99
Directions: SE-NW, SW-NE
Address range: 1 to 99
Huntress St
Length: 0.12 miles
Direction: SE-NW
Address range: 63 to 99
Direction: SE-NW
Address range: 63 to 99
Hooper St
Length: 0.11 miles
Direction: SE-NW
Address range: 33 to 99
Direction: SE-NW
Address range: 33 to 99
Camden Pl
Length: 0.04 miles
Direction: E-W
Address range: 1 to 99
Direction: E-W
Address range: 1 to 99
Vesta Rd
Length: 0.03 miles
Direction: SW-NE
Address range: 1 to 48
Direction: SW-NE
Address range: 1 to 48