Rancho neighborhood in Los Altos, California (CA), 94024 detailed profile
Settings
X


Business Search - 14 Million verified businesses
Area: 0.113 square miles
Population: 756
Population density:
| Rancho: | 6,691 people per square mile |
| Los Altos: | 4,902 people per square mile |

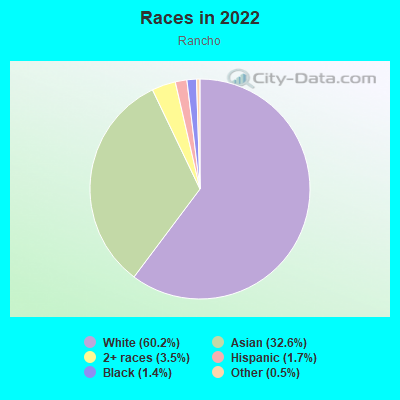
- 46360.2%White
- 25132.6%Asian
- 273.5%Two or more races
- 131.7%Hispanic or Latino
- 111.4%Black
- 40.5%Some other race
Distribution of median household income
![Distribution of median household income]()
- 8Less than $10,000
- 8$10,000 to $19,999
- 17$20,000 to $29,999
- 6$30,000 to $39,999
- 15$40,000 to $49,999
- 4$50,000 to $59,999
- 9$60,000 to $74,999
- 12$75,000 to $99,999
- 7$100,000 to $124,999
- 24$125,000 to $149,999
- 7$150,000 to $199,999
- 174$200,000 or more

Distribution of owner-occupied house/condo value
![Distribution of owner-occupied house/condo value]()
- 4Less than $50,000
- 3$100,000 to $149,999
- 2$300,000 to $399,999
- 2$400,000 to $499,999
- 7$500,000 to $749,999
- 7$750,000 to $999,999
- 238$1,000,000 or more

Distribution of rent paid by renters
![Distribution of rent paid by renters]()
- 13$1,500 to $1,999
- 17$2,000 or more

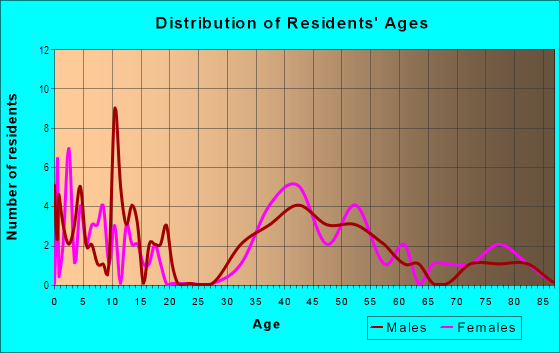
| Males: | 364 |
| Females: | 391 |
Males:
| This neighborhood: | 49.5 years |
| Whole city: | 45.8 years |
| This neighborhood: | 49.5 years |
| Whole city: | 47.1 years |
Average household size:
| Rancho: | 3.0 people |
| Los Altos: | 2.8 people |
Percentage of family households:
| Rancho: | 55.1% |
| Los Altos: | 55.2% |
| Here: | 66.2% |
| Los Altos: | 74.5% |
Percentage of married-couple families with children (among all households):
| Rancho: | 29.8% |
| Los Altos: | 32.9% |
Percentage of single-mother households (among all households):
| Rancho: | 0.9% |
| Los Altos: | 1.2% |
Percentage of never married males 15 years old and over:
Percentage of never married females 15 years old and over:
| Rancho: | 13.8% |
| Los Altos: | 11.8% |
Percentage of never married females 15 years old and over:
| Rancho: | 14.6% |
| city: | 10.5% |
Percentage of people that speak English not well or not at all:
| Rancho: | 0.1% |
| Los Altos: | 1.6% |
Percentage of people born in this state:
Percentage of people born in another U.S. state:
Percentage of native residents but born outside the U.S.:
Percentage of foreign born residents:
| Here: | 48.2% |
| Los Altos: | 41.5% |
Percentage of people born in another U.S. state:
| Rancho: | 22.8% |
| Los Altos: | 23.9% |
Percentage of native residents but born outside the U.S.:
| Here: | 0.9% |
| city: | 1.2% |
Percentage of foreign born residents:
| Here: | 28.1% |
| Los Altos: | 33.5% |
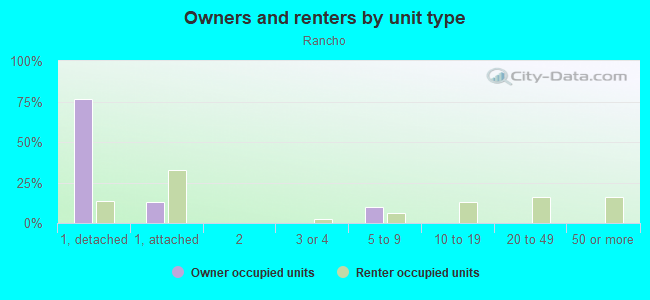
Owner-occupied
Renter-occupied

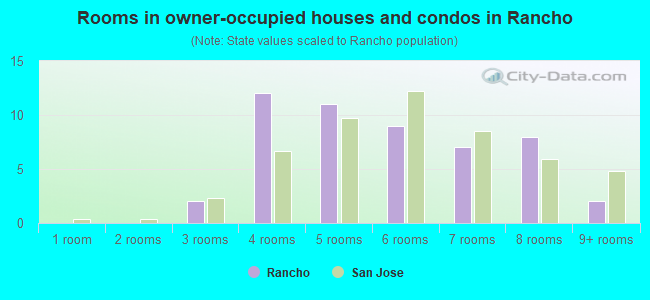
- Rooms in owner-occupied houses and condos in Rancho
- 101 room
- 02 rooms
- 13 rooms
- 54 rooms
- 55 rooms
- 186 rooms
- 657 rooms
- 608 rooms
- 759+ rooms
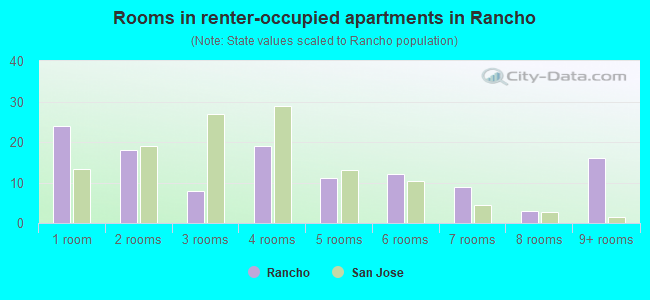
- Rooms in renter-occupied apartments in Rancho
- 31 room
- 02 rooms
- 13 rooms
- 34 rooms
- 115 rooms
- 36 rooms
- 77 rooms
- 38 rooms
- 29+ rooms
Owner-occupied
Renter-occupied
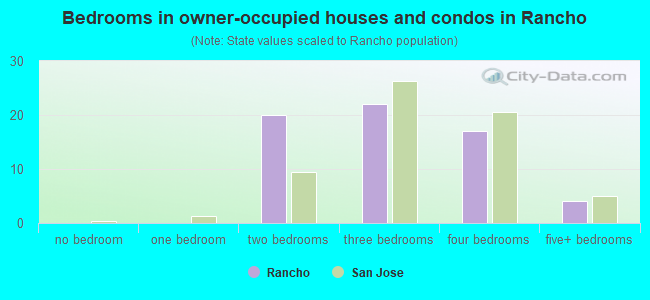
- Bedrooms in owner-occupied houses and condos in Rancho
- 10no bedroom
- 01 bedroom
- 142 bedrooms
- 613 bedrooms
- 1074 bedrooms
- 475+ bedrooms
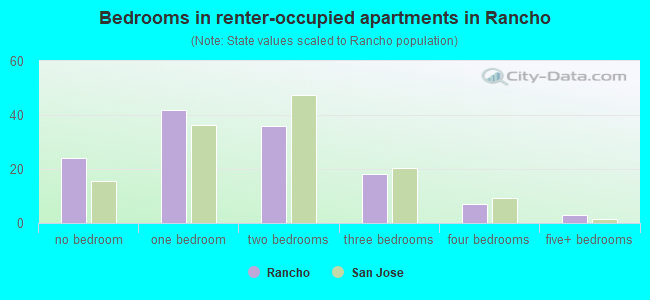
- Bedrooms in renter-occupied apartments in Rancho
- 3no bedroom
- 21 bedroom
- 112 bedrooms
- 33 bedrooms
- 44 bedrooms
- 25+ bedrooms
Average number of cars or other vehicles available in houses/condos:
Average number of cars or other vehicles available in apartments:
| This neighborhood: | 2.1 |
| Los Altos: | 2.3 |
Average number of cars or other vehicles available in apartments:
| Here: | |
| city: |
Percentage of units with a mortgage:
| Rancho: | 60.4% |
| Los Altos: | 63.7% |
Average estimated value of detached houses in 2022 (98.9% of all units):
| Rancho: | $3,346,774 |
| California: | $988,808 |
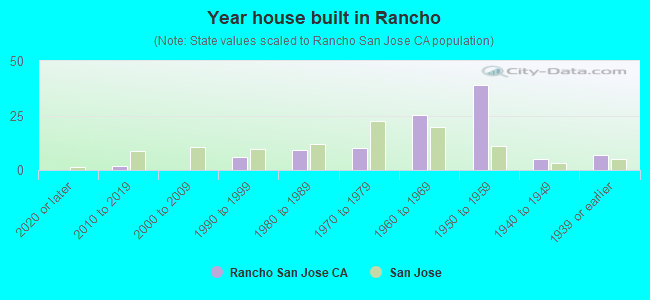
- Year house built in Rancho
- 42020 or later
- 82010 to 2019
- 232000 to 2009
- 91990 to 1999
- 31980 to 1989
- 341970 to 1979
- 831960 to 1969
- 801950 to 1959
- 181940 to 1949
- 61939 or earlier
City-data.com crime index for city in 2020 (higher means more crime):
| City: | 82.4 |
| U.S. average: | 219.5 |
Travel time to work (commute)
![Travel time to work (commute)]()
- 8Less than 5 minutes
- 175 to 9 minutes
- 1610 to 14 minutes
- 3115 to 19 minutes
- 3620 to 24 minutes
- 1925 to 29 minutes
- 2730 to 34 minutes
- 735 to 39 minutes
- 840 to 44 minutes
- 745 to 59 minutes
- 360 to 89 minutes
- 190 or more minutes

Means of transportation to work
![Means of transportation to work]()
- 54.7%157Drove a car alone
- 3.8%11Carpooled
- 1.0%3Subway or elevated rail
- 3.1%9Long-distance train or commuter rail
- 4.5%13Bicycle
- 0.7%2Walked
- 1.0%3Other means
- 36.2%104Worked at home

Time leaving home to go to work
![Time leaving home to go to work]()
- 15:00 a.m. to 5:29 a.m.
- 25:30 a.m. to 5:59 a.m.
- 86:00 a.m. to 6:29 a.m.
- 46:30 a.m. to 6:59 a.m.
- 207:00 a.m. to 7:29 a.m.
- 217:30 a.m. to 7:59 a.m.
- 478:00 a.m. to 8:29 a.m.
- 198:30 a.m. to 8:59 a.m.
- 289:00 a.m. to 9:59 a.m.
- 1410:00 a.m. to 10:59 a.m.
- 411:00 a.m. to 11:59 a.m.
- 812:00 p.m. to 3:59 p.m.
- 44:00 p.m. to 11:59 p.m.

Occupations of males:
- Percentage of males in management occupations (except farmers):
Here: 21.4% city: 30.8%
- Percentage of males in business and financial operations occupations:
Here: 19.5% city: 7.5%
- Percentage of males in computer and mathematical occupations:
Here: 12.1% city: 22.6%
- Percentage of males in architecture and engineering occupations:
Here: 12.3% city: 11.4%
- Percentage of males in legal occupations:
Here: 1.4% city: 2.7%
- Percentage of males in education, training, and library occupations:
Here: 16.2% city: 3.0%
- Percentage of males in arts, design, entertainment, sports, and media occupations:
Here: 1.5% city: 0.9%
- Percentage of males in healthcare practitioners and technical occupations:
Here: 3.9% city: 6.5%
- Percentage of males in sales and office occupations:
Here: 8.4% city: 6.7%
- Percentage of males in construction, extraction, and maintenance occupations:
Here: 2.8% city: 1.1%
Occupations of females:
- Percentage of females in management occupations (except farmers):
Here: 22.6% city: 22.4%
- Percentage of females in business and financial operations occupations:
Here: 17.8% city: 7.5%
- Percentage of females in computer and mathematical occupations:
Here: 5.8% city: 9.5%
- Percentage of females in architecture and engineering occupations:
Here: 6.0% city: 2.3%
- Percentage of females in life, physical, and social science occupations:
Here: 4.2% city: 2.7%
- Percentage of females in legal occupations:
Here: 2.3% city: 4.3%
- Percentage of females in education, training, and library occupations:
Here: 12.4% city: 11.5%
- Percentage of females in healthcare practitioners and technical occupations:
Here: 6.2% city: 13.2%
- Percentage of females in service occupations:
Here: 4.8% city: 6.0%
- Percentage of females in sales and office occupations:
Here: 17.3% city: 10.4%
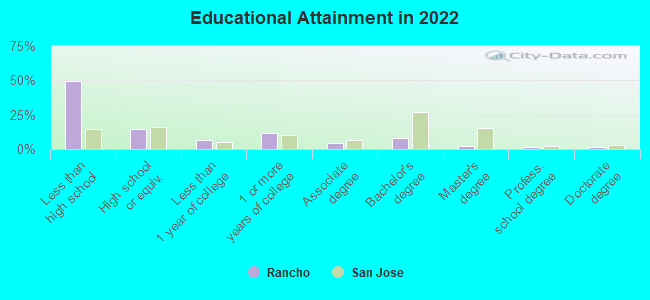
Education in this neighborhood (subdivision or community):
- Percentage of people 3 years and older in K-12 schools:
Rancho: 25.8% Los Altos: 20.4%
- Percentage of people 3 years and older in undergraduate colleges:
Rancho: 7.6% Los Altos: 5.3%
- Percentage of people 3 years and older in grad. or professional schools:
Rancho: 0.5% Los Altos: 1.3%
- Percentage of students K-12 enrolled in private schools:
Rancho: 34.0% Los Altos: 21.7%
Percentage of population below poverty level:
| Rancho: | 0.9% |
| Los Altos: | 3.1% |
Median year owner moved in (as recorded in 2022):
| Rancho: | 2003 |
| Los Altos: | 2004 |
Percentage of married-couple families with both working:
| Rancho: | 57.0% |
| Los Altos: | 64.9% |

- 74.2%Utility gas
- 17.4%Electricity
- 3.3%Solar energy
- 1.9%Bottled, tank, or LP gas
- 1.6%Wood
- 1.6%No fuel used
Limited-access highways (interstate or state) in this neighborhood:
Foothill Expy
Length: 0.21 miles
Direction: SE-NW
Direction: SE-NW
Roads and streets:
Fremont Ave
Length: 0.57 miles
Directions: E-W, N-S, SE-NW, SW-NE
Address range: 500 to 699
Directions: E-W, N-S, SE-NW, SW-NE
Address range: 500 to 699
Covington Rd
Length: 0.42 miles
Directions: E-W, SE-NW
Address range: 500 to 699
Directions: E-W, SE-NW
Address range: 500 to 699
S Springer Rd
Length: 0.40 miles
Directions: N-S, SE-NW
Address range: 1000 to 1299
Directions: N-S, SE-NW
Address range: 1000 to 1299
Riverside Dr
Length: 0.27 miles
Directions: N-S, SE-NW, SW-NE
Address range: 1000 to 1199
Directions: N-S, SE-NW, SW-NE
Address range: 1000 to 1199
Parma Way
Length: 0.25 miles
Directions: N-S, SW-NE
Address range: 950 to 1199
Directions: N-S, SW-NE
Address range: 950 to 1199
Echo Dr
Length: 0.19 miles
Directions: N-S, SW-NE
Address range: 950 to 1099
Directions: N-S, SW-NE
Address range: 950 to 1099
Berry Ave
Length: 0.18 miles
Directions: E-W, SE-NW
Address range: 600 to 699
Directions: E-W, SE-NW
Address range: 600 to 699
Campbell Ave
Length: 0.14 miles
Directions: N-S, SW-NE
Address range: 900 to 1099
Directions: N-S, SW-NE
Address range: 900 to 1099
Briarwood Ct
Length: 0.08 miles
Directions: N-S, SW-NE
Address range: 1100 to 1199
Directions: N-S, SW-NE
Address range: 1100 to 1199
Oakwood Ct
Length: 0.05 miles
Direction: E-W
Address range: 600 to 699
Direction: E-W
Address range: 600 to 699
Rixford Ln
Length: 0.02 miles
Direction: E-W
Address range: 600 to 699
Direction: E-W
Address range: 600 to 699
Other features:
Hale Crk
Length: 0.31 miles
Directions: N-S, SE-NW, SW-NE
Directions: N-S, SE-NW, SW-NE