Queen Anne Historic District (Queen Anne) neighborhood in Reading, Pennsylvania (PA), 19601 detailed profile
Settings
X


Business Search - 14 Million verified businesses
Area: 0.330 square miles
Population: 5,780
Population density:
| Queen Anne Historic District (Queen Anne): | 17,506 people per square mile |
| Reading: | 9,661 people per square mile |

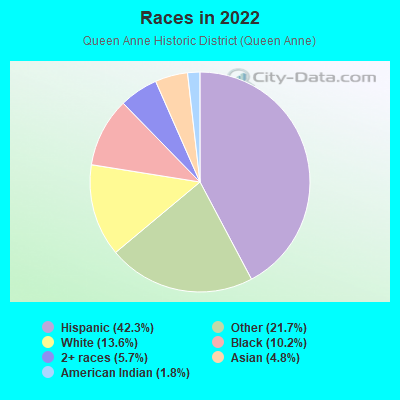
- 3,44342.3%Hispanic or Latino
- 1,76321.7%Some other race
- 1,10513.6%White
- 83110.2%Black
- 4655.7%Two or more races
- 3894.8%Asian
- 1441.8%American Indian
Distribution of median household income
![Distribution of median household income]()
- 116Less than $10,000
- 351$10,000 to $19,999
- 340$20,000 to $29,999
- 483$30,000 to $39,999
- 280$40,000 to $49,999
- 107$50,000 to $59,999
- 232$60,000 to $74,999
- 216$75,000 to $99,999
- 342$100,000 to $124,999
- 219$125,000 to $149,999
- 163$150,000 to $199,999
- 50$200,000 or more

Distribution of owner-occupied house/condo value
![Distribution of owner-occupied house/condo value]()
- 663Less than $50,000
- 1,209$50,000 to $99,999
- 404$100,000 to $149,999
- 115$150,000 to $199,999
- 161$200,000 to $249,999
- 21$250,000 to $299,999
- 15$300,000 to $399,999
- 55$400,000 to $499,999
- 19$500,000 to $749,999
- 3$750,000 to $999,999
- 16$1,000,000 or more

Distribution of rent paid by renters
![Distribution of rent paid by renters]()
- 58$100 to $199
- 52$200 to $299
- 323$300 to $399
- 32$400 to $499
- 130$500 to $599
- 238$600 to $699
- 525$700 to $799
- 338$800 to $899
- 164$900 to $999
- 187$1,000 to $1,249
- 70$1,250 to $1,499

Median rent in 2022:
| Queen Anne Historic District (Queen Anne): | $802 |
| Reading: | $822 |
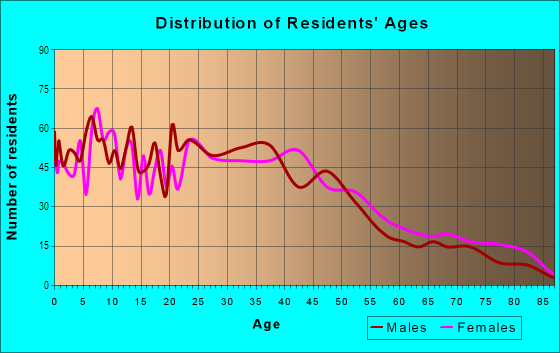
| Males: | 2,775 |
| Females: | 3,004 |
Males:
| This neighborhood: | 30.4 years |
| Whole city: | 32.1 years |
| This neighborhood: | 34.6 years |
| Whole city: | 31.8 years |
Average household size:
| Queen Anne Historic District (Queen Anne): | 5.9 people |
| Reading: | 2.8 people |
Percentage of family households:
| Queen Anne Historic District (Queen Anne): | 49.3% |
| Reading: | 48.4% |
| Here: | 26.9% |
| Reading: | 26.1% |
Percentage of married-couple families with children (among all households):
| Queen Anne Historic District (Queen Anne): | 19.7% |
| Reading: | 11.0% |
Percentage of single-mother households (among all households):
| Queen Anne Historic District (Queen Anne): | 22.3% |
| Reading: | 18.7% |
Percentage of never married males 15 years old and over:
Percentage of never married females 15 years old and over:
| Queen Anne Historic District (Queen Anne): | 22.7% |
| Reading: | 24.6% |
Percentage of never married females 15 years old and over:
| Queen Anne Historic District (Queen Anne): | 27.1% |
| city: | 25.9% |
Percentage of people that speak English not well or not at all:
| Queen Anne Historic District (Queen Anne): | 20.0% |
| Reading: | 15.5% |
Percentage of people born in this state:
Percentage of people born in another U.S. state:
Percentage of native residents but born outside the U.S.:
Percentage of foreign born residents:
| Here: | 48.7% |
| Reading: | 43.0% |
Percentage of people born in another U.S. state:
| Queen Anne Historic District (Queen Anne): | 13.6% |
| Reading: | 18.5% |
Percentage of native residents but born outside the U.S.:
| Here: | 10.4% |
| city: | 15.9% |
Percentage of foreign born residents:
| Here: | 27.3% |
| Reading: | 22.7% |
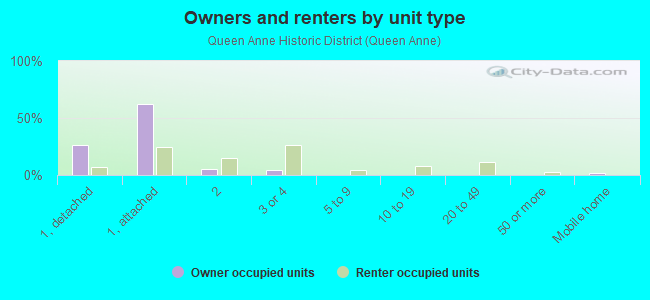
Owner-occupied
Renter-occupied

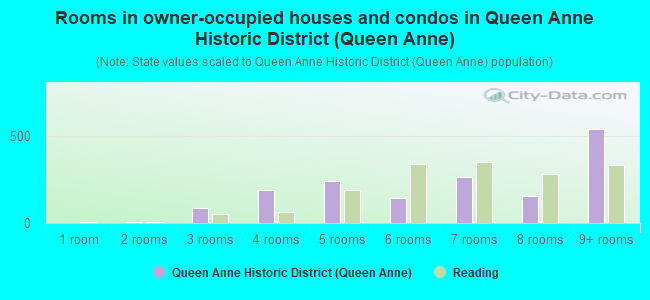
- Rooms in owner-occupied houses and condos in Queen Anne Historic District <
> - 01 room
- 52 rooms
- 843 rooms
- 1894 rooms
- 2455 rooms
- 1426 rooms
- 2657 rooms
- 1568 rooms
- 5439+ rooms
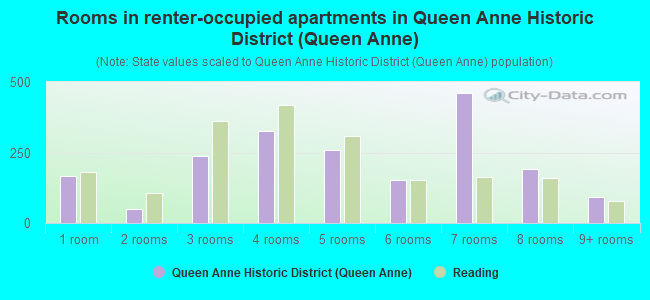
- Rooms in renter-occupied apartments in Queen Anne Historic District <
> - 1661 room
- 512 rooms
- 2383 rooms
- 3264 rooms
- 2585 rooms
- 1516 rooms
- 4607 rooms
- 1908 rooms
- 939+ rooms
Owner-occupied
Renter-occupied
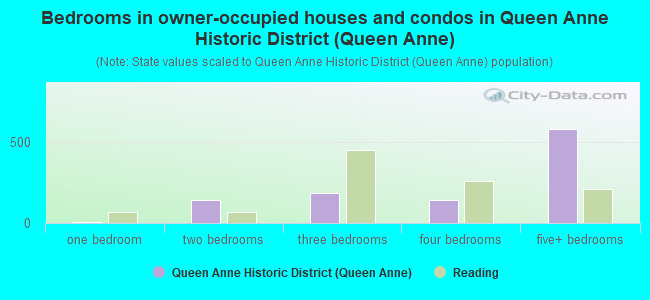
- Bedrooms in owner-occupied houses and condos in Queen Anne Historic District <
> - 0no bedroom
- 51 bedroom
- 1452 bedrooms
- 1893 bedrooms
- 1444 bedrooms
- 5835+ bedrooms
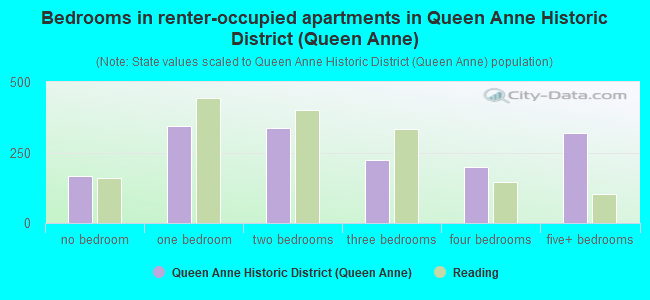
- Bedrooms in renter-occupied apartments in Queen Anne Historic District <
> - 166no bedroom
- 3441 bedroom
- 3362 bedrooms
- 2223 bedrooms
- 2004 bedrooms
- 3205+ bedrooms
Average number of cars or other vehicles available in houses/condos:
Average number of cars or other vehicles available in apartments:
| This neighborhood: | 1.5 |
| Reading: | 1.7 |
Average number of cars or other vehicles available in apartments:
| Here: | 1.1 |
| city: | 1.0 |
Percentage of units with a mortgage:
| Queen Anne Historic District (Queen Anne): | 48.2% |
| Reading: | 52.3% |
Average estimated value of townhouses or other attached units in 2022 (53.7% of all units):
| This neighborhood: | $75,175 |
| city: | $88,387 |
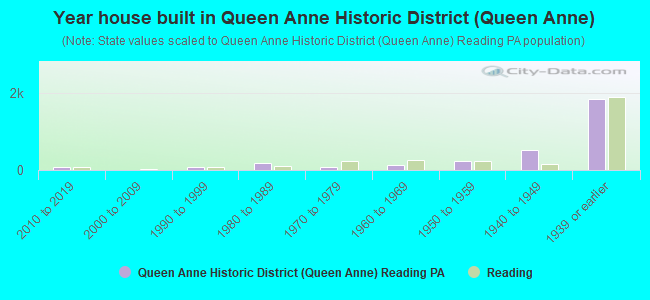
- Year house built in Queen Anne Historic District <
> - 02020 or later
- 752010 to 2019
- 02000 to 2009
- 801990 to 1999
- 1841980 to 1989
- 651970 to 1979
- 1291960 to 1969
- 2211950 to 1959
- 5121940 to 1949
- 1,8241939 or earlier
City-data.com crime index for city in 2020 (higher means more crime):
| City: | 127.5 |
| U.S. average: | 219.5 |
Travel time to work (commute)
![Travel time to work (commute)]()
- 44Less than 5 minutes
- 1455 to 9 minutes
- 42310 to 14 minutes
- 39815 to 19 minutes
- 31920 to 24 minutes
- 17225 to 29 minutes
- 27930 to 34 minutes
- 7135 to 39 minutes
- 24440 to 44 minutes
- 17445 to 59 minutes
- 17960 to 89 minutes
- 3790 or more minutes

Means of transportation to work
![Means of transportation to work]()
- 61.8%1,526Drove a car alone
- 11.5%283Carpooled
- 6.6%162Bus
- 3.4%83Subway or elevated rail
- 7.2%178Taxi
- 12.6%312Bicycle
- 4.1%102Walked
- 9.6%238Other means
- 10.5%260Worked at home

Time leaving home to go to work
![Time leaving home to go to work]()
- 21612:00 a.m. to 4:59 a.m.
- 1595:00 a.m. to 5:29 a.m.
- 1275:30 a.m. to 5:59 a.m.
- 2546:00 a.m. to 6:29 a.m.
- 1356:30 a.m. to 6:59 a.m.
- 1507:00 a.m. to 7:29 a.m.
- 2957:30 a.m. to 7:59 a.m.
- 1368:00 a.m. to 8:29 a.m.
- 548:30 a.m. to 8:59 a.m.
- 649:00 a.m. to 9:59 a.m.
- 5110:00 a.m. to 10:59 a.m.
- 3411:00 a.m. to 11:59 a.m.
- 26812:00 p.m. to 3:59 p.m.
- 1964:00 p.m. to 11:59 p.m.

Occupations of males:
- Percentage of males in management occupations (except farmers):
Here: 3.7% city: 4.8%
- Percentage of males in arts, design, entertainment, sports, and media occupations:
Here: 3.4% city: 1.1%
- Percentage of males in healthcare practitioners and technical occupations:
Here: 1.2% city: 1.3%
- Percentage of males in service occupations:
Here: 21.1% city: 17.8%
- Percentage of males in sales and office occupations:
Here: 14.6% city: 12.9%
- Percentage of males in farming, fishing, and forestry occupations:
Here: 10.8% city: 4.1%
- Percentage of males in construction, extraction, and maintenance occupations:
Here: 7.5% city: 6.2%
- Percentage of males in production occupations:
Here: 11.2% city: 20.3%
- Percentage of males in transportation occupations:
Here: 3.6% city: 7.1%
- Percentage of males in material moving occupations:
Here: 15.9% city: 13.8%
Occupations of females:
- Percentage of females in management occupations (except farmers):
Here: 1.9% city: 3.1%
- Percentage of females in business and financial operations occupations:
Here: 3.2% city: 2.1%
- Percentage of females in community and social services occupations:
Here: 2.4% city: 4.8%
- Percentage of females in education, training, and library occupations:
Here: 9.3% city: 5.1%
- Percentage of females in healthcare practitioners and technical occupations:
Here: 2.0% city: 5.2%
- Percentage of females in service occupations:
Here: 18.0% city: 28.9%
- Percentage of females in sales and office occupations:
Here: 22.3% city: 23.3%
- Percentage of females in farming, fishing, and forestry occupations:
Here: 4.9% city: 2.7%
- Percentage of females in production occupations:
Here: 21.9% city: 13.3%
- Percentage of females in material moving occupations:
Here: 11.8% city: 7.5%
Percentage of people 16-64 in Armed Forces:
| Queen Anne Historic District (Queen Anne): | 0.0% |
| Reading: | 0.1% |
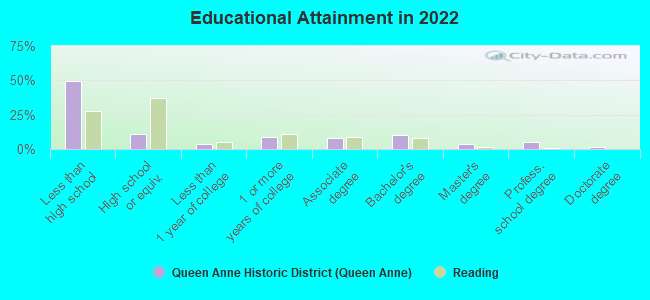
Education in this neighborhood (subdivision or community):
- Percentage of people 3 years and older in K-12 schools:
Queen Anne Historic District (Queen Anne): 27.8% Reading: 22.3%
- Percentage of people 3 years and older in undergraduate colleges:
Queen Anne Historic District (Queen Anne): 7.4% Reading: 4.8%
- Percentage of people 3 years and older in grad. or professional schools:
Queen Anne Historic District (Queen Anne): 1.5% Reading: 0.4%
- Percentage of students K-12 enrolled in private schools:
Queen Anne Historic District (Queen Anne): 57.2% Reading: 7.0%
Percentage of population below poverty level:
| Queen Anne Historic District (Queen Anne): | 30.2% |
| Reading: | 26.8% |
Median year renter moved in (as recorded in 2022):
| Queen Anne Historic District (Queen Anne): | 2013 |
| Reading: | 2019 |
Percentage of married-couple families with both working:
| Queen Anne Historic District (Queen Anne): | 47.5% |
| Reading: | 64.6% |
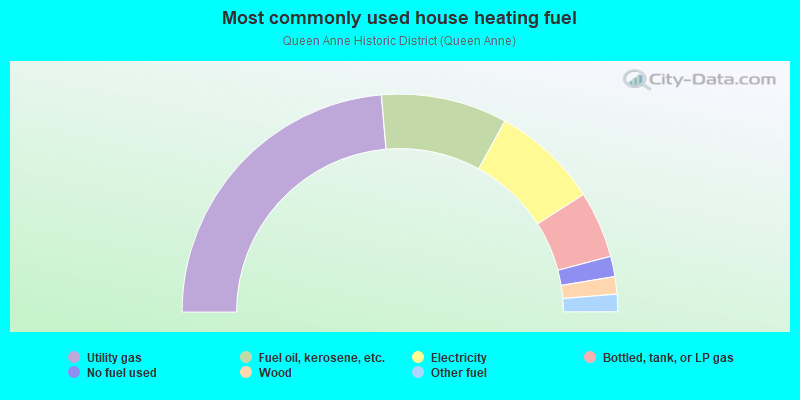
- 47.3%Utility gas
- 18.7%Fuel oil, kerosene, etc.
- 15.9%Electricity
- 9.9%Bottled, tank, or LP gas
- 3.0%No fuel used
- 2.6%Wood
- 2.6%Other fuel
Highways in this neighborhood:
State Rte 61 (Centre Ave)
Length: 0.67 miles
Direction: SE-NW
Address range: 424 to 1099
Direction: SE-NW
Address range: 424 to 1099
US Hwy 222 Bus (N 5th Street Hwy)
Length: 0.47 miles
Direction: N-S
Address range: 535 to 999
Direction: N-S
Address range: 535 to 999
5th St (US Hwy 222 Bus)
Length: 0.14 miles
Direction: N-S
Address range: 400 to 532
Direction: N-S
Address range: 400 to 532
Roads and streets:
N 4th St
Length: 0.67 miles
Directions: E-W, N-S, SW-NE
Address range: 400 to 1047
Directions: E-W, N-S, SW-NE
Address range: 400 to 1047
N 3rd St
Length: 0.65 miles
Directions: N-S, SW-NE
Address range: 400 to 1099
Directions: N-S, SW-NE
Address range: 400 to 1099
N 2nd St
Length: 0.63 miles
Directions: E-W, N-S
Address range: 371 to 999
Directions: E-W, N-S
Address range: 371 to 999
N 6th St
Length: 0.61 miles
Direction: N-S
Address range: 400 to 999
Direction: N-S
Address range: 400 to 999
Greenwich St
Length: 0.58 miles
Direction: E-W
Address range: 166 to 599
Direction: E-W
Address range: 166 to 599
Spring St
Length: 0.54 miles
Direction: E-W
Address range: 175 to 599
Direction: E-W
Address range: 175 to 599
Douglass St
Length: 0.54 miles
Direction: E-W
Address range: 200 to 599
Direction: E-W
Address range: 200 to 599
Windsor St
Length: 0.54 miles
Direction: E-W
Address range: 200 to 598
Direction: E-W
Address range: 200 to 598
Oley St
Length: 0.54 miles
Direction: E-W
Address range: 200 to 599
Direction: E-W
Address range: 200 to 599
Church St
Length: 0.49 miles
Direction: N-S
Address range: 402 to 999
Direction: N-S
Address range: 402 to 999
Madison Ave
Length: 0.49 miles
Direction: N-S
Address range: 600 to 1077
Direction: N-S
Address range: 600 to 1077
Buttonwood St
Length: 0.44 miles
Direction: E-W
Address range: 232 to 599
Direction: E-W
Address range: 232 to 599
Rose St
Length: 0.43 miles
Direction: N-S
Address range: 900 to 999
Direction: N-S
Address range: 900 to 999
Thorn St
Length: 0.38 miles
Direction: N-S
Address range: 500 to 856
Direction: N-S
Address range: 500 to 856
Woodward St
Length: 0.28 miles
Directions: E-W, SW-NE
Address range: 400 to 599
Directions: E-W, SW-NE
Address range: 400 to 599
Green Ter
Length: 0.23 miles
Direction: E-W
Address range: 400 to 499
Direction: E-W
Address range: 400 to 499
Robeson St
Length: 0.18 miles
Direction: E-W
Address range: 200 to 350
Direction: E-W
Address range: 200 to 350
Little Maple St
Length: 0.08 miles
Direction: N-S
Address range: 400 to 499
Direction: N-S
Address range: 400 to 499
Beech St
Length: 0.07 miles
Directions: E-W, N-S
Address range: 146 to 299
Directions: E-W, N-S
Address range: 146 to 299
Hudson St
Length: 0.07 miles
Direction: E-W
Address range: 200 to 299
Direction: E-W
Address range: 200 to 299
Ritters Ct
Length: 0.07 miles
Direction: E-W
Address range: 500 to 599
Direction: E-W
Address range: 500 to 599
Railroad features:
Conrail RR
Length: 0.65 miles
Directions: E-W, SE-NW
Directions: E-W, SE-NW