Queen Anne Business District (Queen Anne) neighborhood in Teaneck, New Jersey (NJ), 07666 detailed profile
Settings
X


Business Search - 14 Million verified businesses
Area: 0.095 square miles
Population: 702
Population density:
| Queen Anne Business District (Queen Anne): | 7,353 people per square mile |
| Teaneck: | 6,486 people per square mile |

- 35146.7%White
- 13618.1%Hispanic or Latino
- 12616.8%Black
- 719.4%Asian
- 587.7%Two or more races
- 101.3%Some other race

Median household income in 2022:
| Queen Anne Business District (Queen Anne): | $150,225 |
| New Jersey: | $96,346 |
Distribution of median household income
![Distribution of median household income]()
- 12Less than $10,000
- 27$10,000 to $19,999
- 27$20,000 to $29,999
- 24$30,000 to $39,999
- 18$40,000 to $49,999
- 14$50,000 to $59,999
- 11$60,000 to $74,999
- 17$75,000 to $99,999
- 20$100,000 to $124,999
- 34$125,000 to $149,999
- 29$150,000 to $199,999
- 76$200,000 or more

Distribution of owner-occupied house/condo value
![Distribution of owner-occupied house/condo value]()
- 15Less than $50,000
- 7$100,000 to $149,999
- 43$150,000 to $199,999
- 12$200,000 to $249,999
- 23$250,000 to $299,999
- 22$300,000 to $399,999
- 79$400,000 to $499,999
- 61$500,000 to $749,999
- 32$750,000 to $999,999
- 11$1,000,000 or more

Distribution of rent paid by renters
![Distribution of rent paid by renters]()
- 5$400 to $499
- 10$900 to $999
- 13$1,000 to $1,249
- 17$1,250 to $1,499
- 10$1,500 to $1,999
- 20$2,000 or more

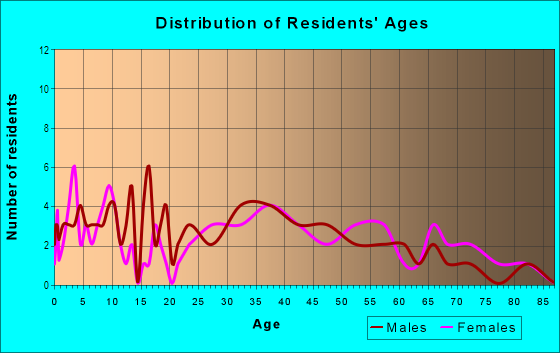
| Males: | 359 |
| Females: | 343 |
| Males: | 34.5 years |
| Females: | 42.3 years |
Average household size:
| Queen Anne Business District (Queen Anne): | 3.5 people |
| New Jersey: | 2.6 people |
Percentage of family households:
| Queen Anne Business District (Queen Anne): | 50.4% |
| New Jersey: | 47.0% |
| Here: | 53.4% |
| New Jersey: | 49.9% |
Percentage of married-couple families with children (among all households):
| Queen Anne Business District (Queen Anne): | 31.7% |
| New Jersey: | 51.5% |
Percentage of single-mother households (among all households):
| Queen Anne Business District (Queen Anne): | 2.2% |
| New Jersey: | 7.6% |
Percentage of never married males 15 years old and over:
Percentage of never married females 15 years old and over:
| Queen Anne Business District (Queen Anne): | 18.8% |
| New Jersey: | 18.2% |
Percentage of never married females 15 years old and over:
| Queen Anne Business District (Queen Anne): | 12.9% |
| New Jersey: | 16.6% |
Percentage of people that speak English not well or not at all:
| Queen Anne Business District (Queen Anne): | 1.8% |
| New Jersey: | 6.5% |
Percentage of people born in this state:
Percentage of people born in another U.S. state:
Percentage of native residents but born outside the U.S.:
Percentage of foreign born residents:
| Here: | 31.8% |
| New Jersey: | 50.7% |
Percentage of people born in another U.S. state:
| Queen Anne Business District (Queen Anne): | 46.7% |
| New Jersey: | 23.4% |
Percentage of native residents but born outside the U.S.:
| Here: | 2.3% |
| New Jersey: | 2.4% |
Percentage of foreign born residents:
| Here: | 19.2% |
| New Jersey: | 23.5% |

Owner-occupied
Renter-occupied


- Rooms in owner-occupied houses and condos in Queen Anne Business District <
> - 01 room
- 122 rooms
- 43 rooms
- 144 rooms
- 155 rooms
- 396 rooms
- 467 rooms
- 368 rooms
- 519+ rooms

- Rooms in renter-occupied apartments in Queen Anne Business District <
> - 21 room
- 212 rooms
- 233 rooms
- 84 rooms
- 135 rooms
- 106 rooms
- 87 rooms
- 148 rooms
- 49+ rooms
Owner-occupied
Renter-occupied

- Bedrooms in owner-occupied houses and condos in Queen Anne Business District <
> - 0no bedroom
- 51 bedroom
- 202 bedrooms
- 963 bedrooms
- 584 bedrooms
- 225+ bedrooms

- Bedrooms in renter-occupied apartments in Queen Anne Business District <
> - 2no bedroom
- 401 bedroom
- 92 bedrooms
- 103 bedrooms
- 144 bedrooms
- 05+ bedrooms
Average number of cars or other vehicles available in houses/condos:
Average number of cars or other vehicles available in apartments:
| This neighborhood: | 1.3 |
| New Jersey: | 2.0 |
Average number of cars or other vehicles available in apartments:
| Here: | |
| New Jersey: |
Percentage of units with a mortgage:
| Queen Anne Business District (Queen Anne): | 65.6% |
| New Jersey: | 63.3% |
Average estimated value of detached houses in 2022 (82.9% of all units):
| Queen Anne Business District (Queen Anne): | $586,271 |
| New Jersey: | $537,591 |

- Year house built in Queen Anne Business District <
> - 02020 or later
- 42010 to 2019
- 112000 to 2009
- 161990 to 1999
- 81980 to 1989
- 191970 to 1979
- 191960 to 1969
- 411950 to 1959
- 441940 to 1949
- 1131939 or earlier

City-data.com crime index for place in 2020 (higher means more crime):
| City: | 86.0 |
| U.S. average: | 219.5 |
Travel time to work (commute)
![Travel time to work (commute)]()
- 14Less than 5 minutes
- 225 to 9 minutes
- 1810 to 14 minutes
- 3615 to 19 minutes
- 1620 to 24 minutes
- 325 to 29 minutes
- 4630 to 34 minutes
- 535 to 39 minutes
- 540 to 44 minutes
- 3545 to 59 minutes
- 4660 to 89 minutes
- 890 or more minutes

Means of transportation to work
![Means of transportation to work]()
- 43.6%149Drove a car alone
- 7.6%26Carpooled
- 12.6%43Bus
- 2.9%10Long-distance train or commuter rail
- 2.3%8Taxi
- 2.9%10Bicycle
- 5.0%17Walked
- 1.8%6Other means
- 30.2%103Worked at home

Time leaving home to go to work
![Time leaving home to go to work]()
- 412:00 a.m. to 4:59 a.m.
- 75:00 a.m. to 5:29 a.m.
- 55:30 a.m. to 5:59 a.m.
- 66:00 a.m. to 6:29 a.m.
- 56:30 a.m. to 6:59 a.m.
- 487:00 a.m. to 7:29 a.m.
- 407:30 a.m. to 7:59 a.m.
- 438:00 a.m. to 8:29 a.m.
- 238:30 a.m. to 8:59 a.m.
- 389:00 a.m. to 9:59 a.m.
- 1410:00 a.m. to 10:59 a.m.
- 211:00 a.m. to 11:59 a.m.
- 612:00 p.m. to 3:59 p.m.
- 44:00 p.m. to 11:59 p.m.

Occupations of males:
- Percentage of males in management occupations (except farmers):
Here: 27.9% New Jersey: 13.9%
- Percentage of males in business and financial operations occupations:
Here: 4.4% New Jersey: 6.9%
- Percentage of males in computer and mathematical occupations:
Here: 7.7% New Jersey: 6.5%
- Percentage of males in life, physical, and social science occupations:
Here: 1.4% New Jersey: 1.2%
- Percentage of males in community and social services occupations:
Here: 5.5% New Jersey: 1.1%
- Percentage of males in legal occupations:
Here: 4.8% New Jersey: 1.5%
- Percentage of males in education, training, and library occupations:
Here: 8.6% New Jersey: 3.6%
- Percentage of males in arts, design, entertainment, sports, and media occupations:
Here: 4.2% New Jersey: 2.0%
- Percentage of males in healthcare practitioners and technical occupations:
Here: 1.5% New Jersey: 3.2%
- Percentage of males in service occupations:
Here: 12.7% New Jersey: 12.9%
- Percentage of males in sales and office occupations:
Here: 12.5% New Jersey: 15.3%
- Percentage of males in construction, extraction, and maintenance occupations:
Here: 3.3% New Jersey: 8.1%
- Percentage of males in production occupations:
Here: 1.0% New Jersey: 4.8%
- Percentage of males in material moving occupations:
Here: 2.0% New Jersey: 4.7%
Occupations of females:
- Percentage of females in management occupations (except farmers):
Here: 15.0% New Jersey: 10.4%
- Percentage of females in business and financial operations occupations:
Here: 3.7% New Jersey: 7.3%
- Percentage of females in life, physical, and social science occupations:
Here: 1.6% New Jersey: 1.4%
- Percentage of females in community and social services occupations:
Here: 11.4% New Jersey: 2.6%
- Percentage of females in legal occupations:
Here: 1.3% New Jersey: 1.6%
- Percentage of females in education, training, and library occupations:
Here: 13.0% New Jersey: 11.4%
- Percentage of females in arts, design, entertainment, sports, and media occupations:
Here: 4.1% New Jersey: 2.2%
- Percentage of females in healthcare practitioners and technical occupations:
Here: 8.0% New Jersey: 9.6%
- Percentage of females in service occupations:
Here: 11.8% New Jersey: 17.2%
- Percentage of females in sales and office occupations:
Here: 27.1% New Jersey: 26.7%
- Percentage of females in production occupations:
Here: 1.1% New Jersey: 2.7%
- Percentage of females in material moving occupations:
Here: 1.2% New Jersey: 2.4%
Education in this neighborhood (subdivision or community):
- Percentage of people 3 years and older in K-12 schools:
Queen Anne Business District (Queen Anne): 20.6% New Jersey: 16.6%
- Percentage of people 3 years and older in undergraduate colleges:
Queen Anne Business District (Queen Anne): 2.3% New Jersey: 4.9%
- Percentage of people 3 years and older in grad. or professional schools:
Queen Anne Business District (Queen Anne): 2.2% New Jersey: 1.6%
- Percentage of students K-12 enrolled in private schools:
Queen Anne Business District (Queen Anne): 67.6% New Jersey: 12.7%
Percentage of population below poverty level:
| Queen Anne Business District (Queen Anne): | 2.6% |
| New Jersey: | 9.7% |
Median year owner moved in (as recorded in 2022):
| Queen Anne Business District (Queen Anne): | 2008 |
| New Jersey: | 2008 |
Percentage of married-couple families with both working:
| Queen Anne Business District (Queen Anne): | 102.0% |
| New Jersey: | 72.0% |

- 64.3%Utility gas
- 15.5%No fuel used
- 10.4%Fuel oil, kerosene, etc.
- 4.9%Bottled, tank, or LP gas
- 4.9%Electricity
Roads and streets:
Cedar Ln
Length: 0.61 miles
Direction: E-W
Address range: 130 to 377
Direction: E-W
Address range: 130 to 377
Palisade Ave
Length: 0.50 miles
Direction: SW-NE
Address range: 668 to 901
Direction: SW-NE
Address range: 668 to 901
Frances St
Length: 0.31 miles
Directions: E-W, SE-NW, SW-NE
Address range: 241 to 343
Directions: E-W, SE-NW, SW-NE
Address range: 241 to 343
Railroad Pl
Length: 0.24 miles
Directions: SE-NW, SW-NE
Directions: SE-NW, SW-NE
Chadwick Rd
Length: 0.22 miles
Directions: E-W, SE-NW
Address range: 127 to 215
Directions: E-W, SE-NW
Address range: 127 to 215
Barr Ave
Length: 0.21 miles
Direction: E-W
Address range: 271 to 350
Direction: E-W
Address range: 271 to 350
Queen Anne Rd
Length: 0.13 miles
Direction: SW-NE
Address range: 757 to 827
Direction: SW-NE
Address range: 757 to 827
Grange Rd
Length: 0.07 miles
Directions: N-S, SW-NE
Address range: 751 to 799
Directions: N-S, SW-NE
Address range: 751 to 799
Red Rd
Length: 0.06 miles
Directions: N-S, SW-NE
Address range: 795 to 828
Directions: N-S, SW-NE
Address range: 795 to 828
Manor Ct
Length: 0.05 miles
Direction: SE-NW
Direction: SE-NW
Demott Ave
Length: 0.05 miles
Direction: SE-NW
Address range: 374 to 399
Direction: SE-NW
Address range: 374 to 399
Railroad features:
Conrail RR (Csx)
Length: 0.29 miles
Direction: SW-NE
Direction: SW-NE