Pioneer Homes neighborhood in Glendale, California (CA), 91207 detailed profile
Settings
X


Business Search - 14 Million verified businesses
Area: 0.133 square miles
Population: 1,164
Population density:
| Pioneer Homes: | 8,757 people per square mile |
| Glendale: | 6,175 people per square mile |

- 89061.8%White
- 41528.8%Two or more races
- 785.4%Asian
- 402.8%Hispanic or Latino
- 181.2%Black

Distribution of median household income
![Distribution of median household income]()
- 38Less than $10,000
- 127$10,000 to $19,999
- 31$20,000 to $29,999
- 147$30,000 to $39,999
- 24$40,000 to $49,999
- 22$50,000 to $59,999
- 20$60,000 to $74,999
- 61$75,000 to $99,999
- 14$100,000 to $124,999
- 29$125,000 to $149,999
- 45$150,000 to $199,999
- 167$200,000 or more

Distribution of owner-occupied house/condo value
![Distribution of owner-occupied house/condo value]()
- 53Less than $50,000
- 4$250,000 to $299,999
- 2$300,000 to $399,999
- 10$400,000 to $499,999
- 84$500,000 to $749,999
- 93$750,000 to $999,999
- 205$1,000,000 or more

Distribution of rent paid by renters
![Distribution of rent paid by renters]()
- 127$500 to $599
- 6$600 to $699
- 55$1,000 to $1,249
- 11$1,250 to $1,499
- 187$1,500 to $1,999
- 123$2,000 or more

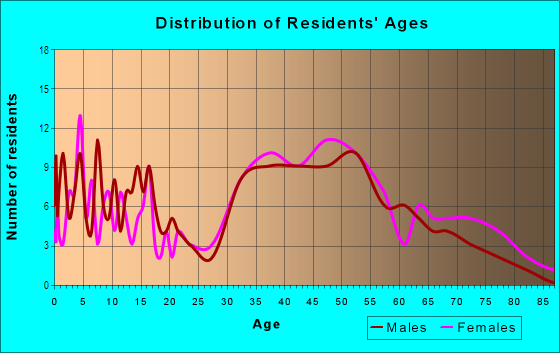
| Males: | 580 |
| Females: | 583 |
Males:
| This neighborhood: | 41.6 years |
| Whole city: | 41.8 years |
| This neighborhood: | 45.9 years |
| Whole city: | 43.4 years |
Average household size:
| Pioneer Homes: | 2.7 people |
| Glendale: | 2.5 people |
Percentage of family households:
| Pioneer Homes: | 35.2% |
| Glendale: | 40.0% |
| Here: | 49.3% |
| Glendale: | 44.2% |
Percentage of married-couple families with children (among all households):
| Pioneer Homes: | 30.9% |
| Glendale: | 30.5% |
Percentage of single-mother households (among all households):
| Pioneer Homes: | 11.7% |
| Glendale: | 7.0% |
Percentage of never married males 15 years old and over:
Percentage of never married females 15 years old and over:
| Pioneer Homes: | 9.8% |
| Glendale: | 18.4% |
Percentage of never married females 15 years old and over:
| Pioneer Homes: | 16.0% |
| city: | 18.3% |
Percentage of people that speak English not well or not at all:
| Pioneer Homes: | 12.7% |
| Glendale: | 12.5% |
Percentage of people born in this state:
Percentage of people born in another U.S. state:
Percentage of native residents but born outside the U.S.:
Percentage of foreign born residents:
| Here: | 36.8% |
| Glendale: | 38.0% |
Percentage of people born in another U.S. state:
| Pioneer Homes: | 16.0% |
| Glendale: | 11.6% |
Percentage of native residents but born outside the U.S.:
| Here: | 1.4% |
| city: | 1.5% |
Percentage of foreign born residents:
| Here: | 45.9% |
| Glendale: | 48.9% |

Owner-occupied
Renter-occupied


- Rooms in owner-occupied houses and condos in Pioneer Homes
- 01 room
- 02 rooms
- 83 rooms
- 144 rooms
- 215 rooms
- 486 rooms
- 767 rooms
- 1558 rooms
- 259+ rooms

- Rooms in renter-occupied apartments in Pioneer Homes
- 91 room
- 272 rooms
- 1043 rooms
- 264 rooms
- 205 rooms
- 1876 rooms
- 187 rooms
- 38 rooms
- 129+ rooms
Owner-occupied
Renter-occupied

- Bedrooms in owner-occupied houses and condos in Pioneer Homes
- 0no bedroom
- 91 bedroom
- 402 bedrooms
- 2473 bedrooms
- 264 bedrooms
- 205+ bedrooms

- Bedrooms in renter-occupied apartments in Pioneer Homes
- 27no bedroom
- 1041 bedroom
- 302 bedrooms
- 613 bedrooms
- 1384 bedrooms
- 05+ bedrooms
Average number of cars or other vehicles available in houses/condos:
Average number of cars or other vehicles available in apartments:
| This neighborhood: | 2.0 |
| Glendale: | 2.0 |
Average number of cars or other vehicles available in apartments:
| Here: | |
| city: |
Percentage of units with a mortgage:
| Pioneer Homes: | 75.5% |
| Glendale: | 73.0% |
Average estimated value of detached houses in 2022 (100.0% of all units):
| Pioneer Homes: | $1,105,482 |
| Glendale: | $1,271,064 |

- Year house built in Pioneer Homes
- 02020 or later
- 02010 to 2019
- 42000 to 2009
- 261990 to 1999
- 241980 to 1989
- 431970 to 1979
- 371960 to 1969
- 741950 to 1959
- 1881940 to 1949
- 2571939 or earlier

City-data.com crime index for city in 2020 (higher means more crime):
| City: | 110.5 |
| U.S. average: | 219.5 |
Travel time to work (commute)
![Travel time to work (commute)]()
- 145 to 9 minutes
- 7410 to 14 minutes
- 6315 to 19 minutes
- 3620 to 24 minutes
- 425 to 29 minutes
- 5630 to 34 minutes
- 1435 to 39 minutes
- 1940 to 44 minutes
- 3145 to 59 minutes
- 5960 to 89 minutes
- 1790 or more minutes

Means of transportation to work
![Means of transportation to work]()
- 70.7%300Drove a car alone
- 10.6%45Carpooled
- 0.2%1Bus
- 0.5%2Long-distance train or commuter rail
- 3.5%15Bicycle
- 1.9%8Walked
- 4.0%17Other means
- 21.2%90Worked at home

Time leaving home to go to work
![Time leaving home to go to work]()
- 312:00 a.m. to 4:59 a.m.
- 25:00 a.m. to 5:29 a.m.
- 186:00 a.m. to 6:29 a.m.
- 366:30 a.m. to 6:59 a.m.
- 637:00 a.m. to 7:29 a.m.
- 347:30 a.m. to 7:59 a.m.
- 648:00 a.m. to 8:29 a.m.
- 368:30 a.m. to 8:59 a.m.
- 599:00 a.m. to 9:59 a.m.
- 4410:00 a.m. to 10:59 a.m.
- 1512:00 p.m. to 3:59 p.m.
- 214:00 p.m. to 11:59 p.m.

Occupations of males:
- Percentage of males in management occupations (except farmers):
Here: 22.5% city: 12.9%
- Percentage of males in business and financial operations occupations:
Here: 22.6% city: 4.8%
- Percentage of males in computer and mathematical occupations:
Here: 2.3% city: 5.2%
- Percentage of males in architecture and engineering occupations:
Here: 6.7% city: 4.1%
- Percentage of males in legal occupations:
Here: 3.6% city: 1.2%
- Percentage of males in arts, design, entertainment, sports, and media occupations:
Here: 5.4% city: 8.9%
- Percentage of males in service occupations:
Here: 11.4% city: 11.8%
- Percentage of males in sales and office occupations:
Here: 13.5% city: 18.3%
- Percentage of males in production occupations:
Here: 1.0% city: 4.2%
- Percentage of males in material moving occupations:
Here: 9.0% city: 2.3%
Occupations of females:
- Percentage of females in management occupations (except farmers):
Here: 4.2% city: 10.3%
- Percentage of females in computer and mathematical occupations:
Here: 3.2% city: 1.6%
- Percentage of females in architecture and engineering occupations:
Here: 5.4% city: 1.0%
- Percentage of females in legal occupations:
Here: 4.2% city: 2.6%
- Percentage of females in education, training, and library occupations:
Here: 6.7% city: 9.4%
- Percentage of females in arts, design, entertainment, sports, and media occupations:
Here: 18.2% city: 6.1%
- Percentage of females in healthcare practitioners and technical occupations:
Here: 26.1% city: 10.7%
- Percentage of females in service occupations:
Here: 5.0% city: 18.3%
- Percentage of females in sales and office occupations:
Here: 26.9% city: 26.5%
- Percentage of females in production occupations:
Here: 1.6% city: 1.5%
- Percentage of females in material moving occupations:
Here: 4.1% city: 0.7%
Education in this neighborhood (subdivision or community):
- Percentage of people 3 years and older in K-12 schools:
Pioneer Homes: 25.6% Glendale: 14.1%
- Percentage of people 3 years and older in undergraduate colleges:
Pioneer Homes: 15.2% Glendale: 5.2%
- Percentage of people 3 years and older in grad. or professional schools:
Pioneer Homes: 3.8% Glendale: 1.9%
- Percentage of students K-12 enrolled in private schools:
Pioneer Homes: 25.3% Glendale: 9.3%
Percentage of population below poverty level:
| Pioneer Homes: | 7.0% |
| Glendale: | 13.0% |
Median year owner moved in (as recorded in 2022):
| Pioneer Homes: | 2006 |
| Glendale: | 2007 |
Percentage of married-couple families with both working:
| Pioneer Homes: | 71.3% |
| Glendale: | 66.7% |

- 74.7%Utility gas
- 15.3%Electricity
- 4.2%No fuel used
- 3.4%Other fuel
- 2.4%Bottled, tank, or LP gas
Roads and streets:
E Stocker St
Length: 0.47 miles
Directions: E-W, SE-NW
Address range: 600 to 999
Directions: E-W, SE-NW
Address range: 600 to 999
Rossmoyne Ave
Length: 0.16 miles
Directions: N-S, SW-NE
Address range: 1111 to 1245
Directions: N-S, SW-NE
Address range: 1111 to 1245
del Rey Dr
Length: 0.11 miles
Direction: E-W
Address range: 900 to 999
Direction: E-W
Address range: 900 to 999
Cordova Ave
Length: 0.11 miles
Direction: N-S
Address range: 1132 to 1225
Direction: N-S
Address range: 1132 to 1225
Cabrillo Dr
Length: 0.11 miles
Direction: E-W
Address range: 900 to 999
Direction: E-W
Address range: 900 to 999