Pine Bend neighborhood in Inver Grove Heights, Minnesota (MN), 55068, 55077 detailed profile
Settings
X


Business Search - 14 Million verified businesses
Area: 1.045 square miles
Population: 384
Population density:
| Pine Bend: | 367 people per square mile |
| Inver Grove Heights: | 1,246 people per square mile |

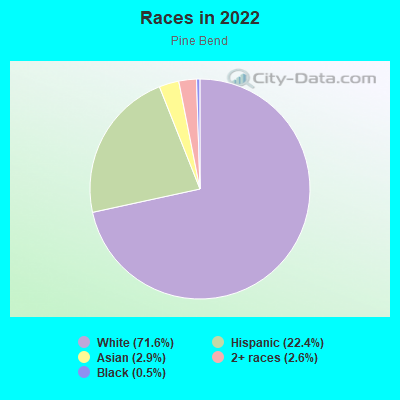
- 27571.6%White
- 8622.4%Hispanic or Latino
- 112.9%Asian
- 102.6%Two or more races
- 20.5%Black
Distribution of median household income
![Distribution of median household income]()
- 2Less than $10,000
- 15$10,000 to $19,999
- 16$20,000 to $29,999
- 14$30,000 to $39,999
- 6$40,000 to $49,999
- 2$50,000 to $59,999
- 7$60,000 to $74,999
- 7$75,000 to $99,999
- 10$100,000 to $124,999
- 24$125,000 to $149,999
- 13$150,000 to $199,999
- 34$200,000 or more

Distribution of owner-occupied house/condo value
![Distribution of owner-occupied house/condo value]()
- 23Less than $50,000
- 9$50,000 to $99,999
- 3$100,000 to $149,999
- 10$150,000 to $199,999
- 10$200,000 to $249,999
- 6$250,000 to $299,999
- 10$300,000 to $399,999
- 41$400,000 to $499,999
- 34$500,000 to $749,999
- 13$750,000 to $999,999
- 4$1,000,000 or more

Distribution of rent paid by renters
![Distribution of rent paid by renters]()
- 1$500 to $599
- 3$600 to $699
- 2$700 to $799
- 8$800 to $899
- 2$900 to $999
- 3$1,000 to $1,249
- 11$1,250 to $1,499
- 5$1,500 to $1,999
- 1$2,000 or more

| Males: | 206 |
| Females: | 177 |
Males:
| This neighborhood: | |
| Whole city: |
| This neighborhood: | |
| Whole city: |
Percentage of family households:
| Pine Bend: | 60.4% |
| Inver Grove Heights: | 50.9% |
| Here: | 66.5% |
| Inver Grove Heights: | 53.0% |
Percentage of married-couple families with children (among all households):
| Pine Bend: | 25.4% |
| Inver Grove Heights: | 30.1% |
Percentage of single-mother households (among all households):
| Pine Bend: | 8.8% |
| Inver Grove Heights: | 8.6% |
Percentage of never married males 15 years old and over:
Percentage of never married females 15 years old and over:
| Pine Bend: | 13.0% |
| Inver Grove Heights: | 14.9% |
Percentage of never married females 15 years old and over:
| Pine Bend: | 11.7% |
| city: | 15.0% |
Percentage of people that speak English not well or not at all:
| Pine Bend: | 1.4% |
| Inver Grove Heights: | 1.0% |
Percentage of people born in this state:
Percentage of people born in another U.S. state:
Percentage of native residents but born outside the U.S.:
Percentage of foreign born residents:
| Here: | 70.2% |
| Inver Grove Heights: | 69.1% |
Percentage of people born in another U.S. state:
| Pine Bend: | 21.8% |
| Inver Grove Heights: | 20.4% |
Percentage of native residents but born outside the U.S.:
| Here: | 0.5% |
| city: | 1.0% |
Percentage of foreign born residents:
| Here: | 7.7% |
| Inver Grove Heights: | 9.4% |
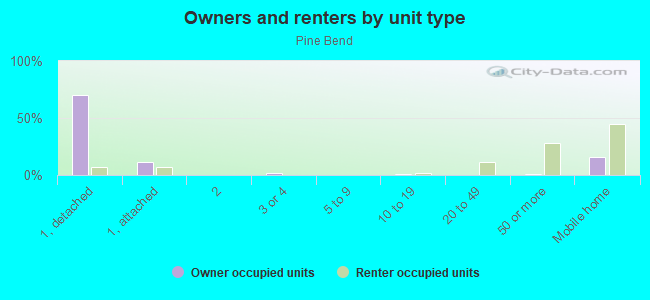
Owner-occupied
Renter-occupied

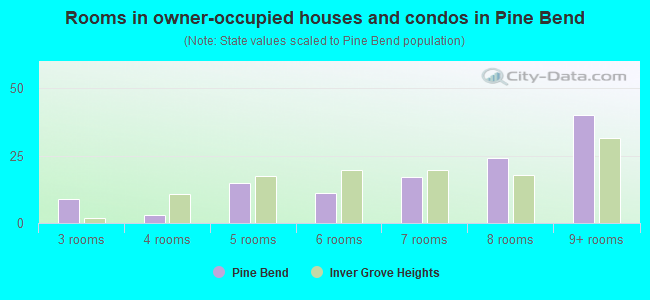
- Rooms in owner-occupied houses and condos in Pine Bend
- 01 room
- 02 rooms
- 93 rooms
- 34 rooms
- 155 rooms
- 116 rooms
- 177 rooms
- 248 rooms
- 409+ rooms
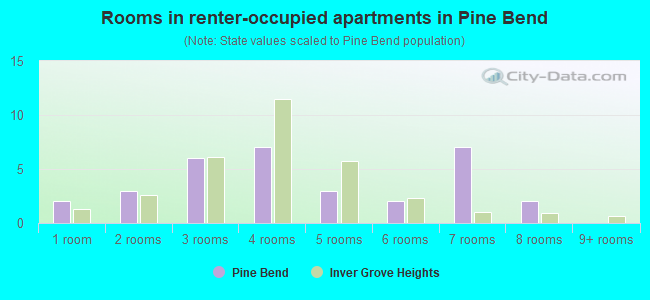
- Rooms in renter-occupied apartments in Pine Bend
- 21 room
- 32 rooms
- 63 rooms
- 74 rooms
- 35 rooms
- 26 rooms
- 77 rooms
- 28 rooms
- 09+ rooms
Owner-occupied
Renter-occupied
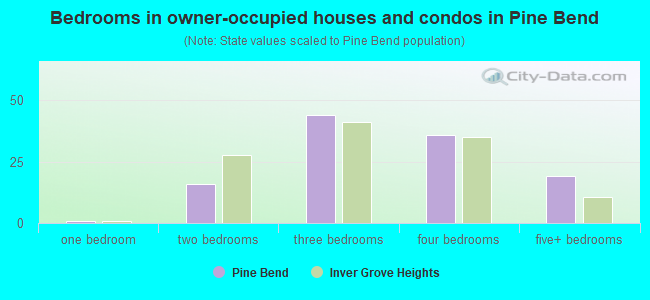
- Bedrooms in owner-occupied houses and condos in Pine Bend
- 0no bedroom
- 11 bedroom
- 162 bedrooms
- 443 bedrooms
- 364 bedrooms
- 195+ bedrooms
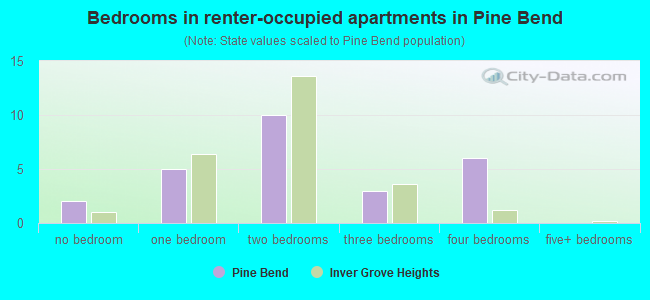
- Bedrooms in renter-occupied apartments in Pine Bend
- 2no bedroom
- 51 bedroom
- 102 bedrooms
- 33 bedrooms
- 64 bedrooms
- 05+ bedrooms
Average number of cars or other vehicles available in houses/condos:
Average number of cars or other vehicles available in apartments:
| This neighborhood: | |
| Inver Grove Heights: |
Average number of cars or other vehicles available in apartments:
| Here: | |
| city: |
Percentage of units with a mortgage:
| Pine Bend: | 56.9% |
| Inver Grove Heights: | 67.7% |
Average estimated value of detached houses in 2022 (69.9% of all units):
| Pine Bend: | $347,989 |
| Minnesota: | $374,552 |
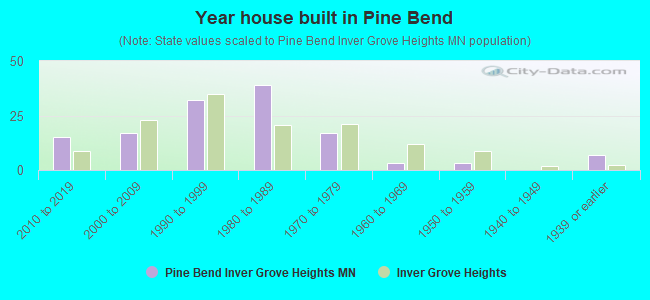
- Year house built in Pine Bend
- 02020 or later
- 152010 to 2019
- 172000 to 2009
- 321990 to 1999
- 391980 to 1989
- 171970 to 1979
- 31960 to 1969
- 31950 to 1959
- 01940 to 1949
- 71939 or earlier
City-data.com crime index for city in 2020 (higher means more crime):
| City: | 197.4 |
| U.S. average: | 219.5 |
Travel time to work (commute)
![Travel time to work (commute)]()
- 2Less than 5 minutes
- 75 to 9 minutes
- 2710 to 14 minutes
- 1215 to 19 minutes
- 1920 to 24 minutes
- 2125 to 29 minutes
- 2030 to 34 minutes
- 735 to 39 minutes
- 140 to 44 minutes
- 445 to 59 minutes
- 360 to 89 minutes

Means of transportation to work
![Means of transportation to work]()
- 66.3%133Drove a car alone
- 7.0%14Carpooled
- 1.0%2Bus
- 1.0%2Bicycle
- 0.5%1Walked
- 26.4%53Worked at home

Time leaving home to go to work
![Time leaving home to go to work]()
- 1112:00 a.m. to 4:59 a.m.
- 25:00 a.m. to 5:29 a.m.
- 45:30 a.m. to 5:59 a.m.
- 166:00 a.m. to 6:29 a.m.
- 126:30 a.m. to 6:59 a.m.
- 257:00 a.m. to 7:29 a.m.
- 187:30 a.m. to 7:59 a.m.
- 88:00 a.m. to 8:29 a.m.
- 68:30 a.m. to 8:59 a.m.
- 49:00 a.m. to 9:59 a.m.
- 110:00 a.m. to 10:59 a.m.
- 111:00 a.m. to 11:59 a.m.
- 612:00 p.m. to 3:59 p.m.
- 94:00 p.m. to 11:59 p.m.

Occupations of males:
- Percentage of males in management occupations (except farmers):
Here: 11.3% city: 12.1%
- Percentage of males in business and financial operations occupations:
Here: 6.7% city: 6.4%
- Percentage of males in computer and mathematical occupations:
Here: 9.9% city: 10.0%
- Percentage of males in architecture and engineering occupations:
Here: 5.2% city: 3.7%
- Percentage of males in education, training, and library occupations:
Here: 3.1% city: 1.8%
- Percentage of males in service occupations:
Here: 7.7% city: 8.7%
- Percentage of males in sales and office occupations:
Here: 17.6% city: 20.7%
- Percentage of males in construction, extraction, and maintenance occupations:
Here: 17.8% city: 6.8%
- Percentage of males in production occupations:
Here: 7.0% city: 6.8%
- Percentage of males in transportation occupations:
Here: 7.4% city: 7.7%
- Percentage of males in material moving occupations:
Here: 3.4% city: 5.1%
Occupations of females:
- Percentage of females in management occupations (except farmers):
Here: 10.2% city: 9.7%
- Percentage of females in business and financial operations occupations:
Here: 20.2% city: 10.9%
- Percentage of females in computer and mathematical occupations:
Here: 4.1% city: 5.6%
- Percentage of females in architecture and engineering occupations:
Here: 2.2% city: 0.8%
- Percentage of females in community and social services occupations:
Here: 2.8% city: 1.7%
- Percentage of females in arts, design, entertainment, sports, and media occupations:
Here: 3.3% city: 1.7%
- Percentage of females in healthcare practitioners and technical occupations:
Here: 13.0% city: 9.8%
- Percentage of females in service occupations:
Here: 7.5% city: 19.2%
- Percentage of females in sales and office occupations:
Here: 31.9% city: 25.5%
- Percentage of females in production occupations:
Here: 3.0% city: 1.0%
- Percentage of females in material moving occupations:
Here: 1.1% city: 0.9%
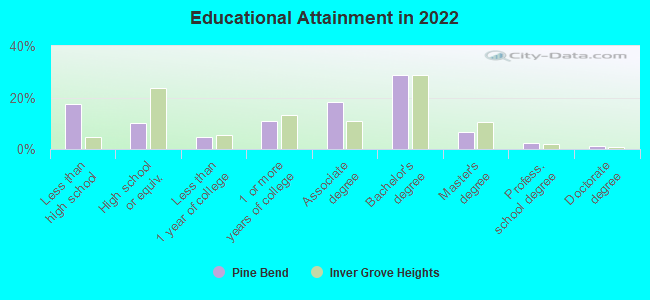
Education in this neighborhood (subdivision or community):
- Percentage of people 3 years and older in K-12 schools:
Pine Bend: 22.0% Inver Grove Heights: 17.2%
- Percentage of people 3 years and older in undergraduate colleges:
Pine Bend: 4.8% Inver Grove Heights: 3.9%
- Percentage of people 3 years and older in grad. or professional schools:
Pine Bend: 0.5% Inver Grove Heights: 1.3%
- Percentage of students K-12 enrolled in private schools:
Pine Bend: 18.3% Inver Grove Heights: 12.3%
Percentage of population below poverty level:
| Pine Bend: | 8.5% |
| Inver Grove Heights: | 5.7% |
Percentage of married-couple families with both working:
| Pine Bend: | 95.0% |
| Inver Grove Heights: | 81.5% |
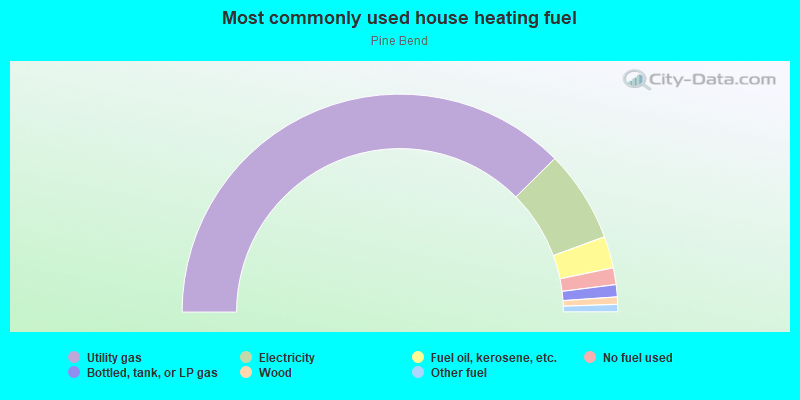
- 75.2%Utility gas
- 13.7%Electricity
- 4.7%Fuel oil, kerosene, etc.
- 2.5%No fuel used
- 1.8%Bottled, tank, or LP gas
- 1.1%Wood
- 1.1%Other fuel
Highways in this neighborhood:
US Hwy 52 (Courthouse Blvd, State Hwy 55 E, Courthouse Blvd E, State Hwy 55)
Length: 2.44 miles
Directions: E-W, N-S, SE-NW
Address range: 10996 to 11999
Directions: E-W, N-S, SE-NW
Address range: 10996 to 11999
Roads and streets:
Clark Rd
Length: 0.83 miles
Directions: E-W, N-S, SE-NW, SW-NE
Directions: E-W, N-S, SE-NW, SW-NE
117th St E
Length: 0.72 miles
Direction: E-W
Address range: 3124 to 3899
Direction: E-W
Address range: 3124 to 3899
111th St E
Length: 0.40 miles
Directions: E-W, N-S, SE-NW
Address range: 3500 to 3599
Directions: E-W, N-S, SE-NW
Address range: 3500 to 3599
Clark Ave
Length: 0.34 miles
Directions: N-S, SE-NW
Address range: 11700 to 11935
Directions: N-S, SE-NW
Address range: 11700 to 11935
Railroad features:
Abandoned RR
Length: 1.96 miles
Directions: E-W, N-S, SE-NW, SW-NE
Directions: E-W, N-S, SE-NW, SW-NE