Pheasant Brook Estates neighborhood in Lexington, Massachusetts (MA), 02420 detailed profile
Settings
X


Business Search - 14 Million verified businesses
Area: 0.266 square miles
Population: 481
Population density:
| Pheasant Brook Estates: | 1,806 people per square mile |
| Lexington: | 2,087 people per square mile |

- 27254.6%White
- 17835.7%Asian
- 193.8%Two or more races
- 112.2%Black
- 112.2%Hispanic or Latino
- 71.4%Some other race

Median household income in 2022:
| Pheasant Brook Estates: | $231,338 |
| Lexington: | $206,323 |
Distribution of median household income
![Distribution of median household income]()
- 3Less than $10,000
- 5$10,000 to $19,999
- 12$20,000 to $29,999
- 4$30,000 to $39,999
- 8$40,000 to $49,999
- 2$50,000 to $59,999
- 4$60,000 to $74,999
- 6$75,000 to $99,999
- 5$100,000 to $124,999
- 9$125,000 to $149,999
- 24$150,000 to $199,999
- 101$200,000 or more

Distribution of owner-occupied house/condo value
![Distribution of owner-occupied house/condo value]()
- 6Less than $50,000
- 3$50,000 to $99,999
- 1$250,000 to $299,999
- 2$300,000 to $399,999
- 4$400,000 to $499,999
- 10$500,000 to $749,999
- 33$750,000 to $999,999
- 99$1,000,000 or more

Distribution of rent paid by renters
![Distribution of rent paid by renters]()
- 3$200 to $299
- 4$300 to $399
- 2$400 to $499
- 4$500 to $599
- 1$600 to $699
- 3$800 to $899
- 1$1,000 to $1,249
- 4$1,250 to $1,499
- 4$1,500 to $1,999
- 27$2,000 or more

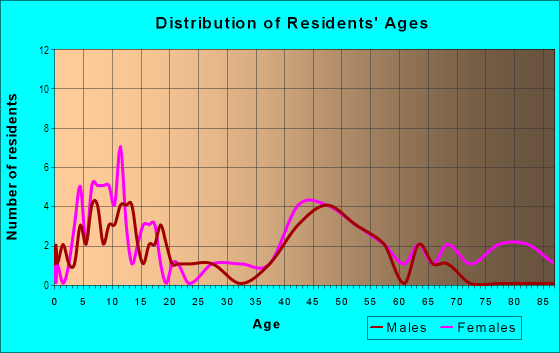
| Males: | 225 |
| Females: | 256 |
Males:
| This neighborhood: | 47.9 years |
| Whole city: | 47.2 years |
| This neighborhood: | 47.2 years |
| Whole city: | 46.5 years |
Average household size:
| Pheasant Brook Estates: | 2.8 people |
| Lexington: | 2.7 people |
Percentage of family households:
| Pheasant Brook Estates: | 62.4% |
| Lexington: | 54.6% |
| Here: | 74.0% |
| Lexington: | 70.8% |
Percentage of married-couple families with children (among all households):
| Pheasant Brook Estates: | 32.4% |
| Lexington: | 32.4% |
Percentage of single-mother households (among all households):
| Pheasant Brook Estates: | 2.3% |
| Lexington: | 2.3% |
Percentage of never married males 15 years old and over:
Percentage of never married females 15 years old and over:
| Pheasant Brook Estates: | 9.9% |
| Lexington: | 9.7% |
Percentage of never married females 15 years old and over:
| Pheasant Brook Estates: | 15.8% |
| place: | 11.8% |
Percentage of people that speak English not well or not at all:
| Pheasant Brook Estates: | 0.6% |
| Lexington: | 3.1% |
Percentage of people born in this state:
Percentage of people born in another U.S. state:
Percentage of native residents but born outside the U.S.:
Percentage of foreign born residents:
| Here: | 36.1% |
| Lexington: | 36.4% |
Percentage of people born in another U.S. state:
| Pheasant Brook Estates: | 25.1% |
| Lexington: | 28.7% |
Percentage of native residents but born outside the U.S.:
| Here: | 0.6% |
| place: | 2.0% |
Percentage of foreign born residents:
| Here: | 38.2% |
| Lexington: | 32.9% |

Owner-occupied
Renter-occupied


- Rooms in owner-occupied houses and condos in Pheasant Brook Estates
- 01 room
- 02 rooms
- 13 rooms
- 84 rooms
- 195 rooms
- 146 rooms
- 217 rooms
- 218 rooms
- 589+ rooms

- Rooms in renter-occupied apartments in Pheasant Brook Estates
- 01 room
- 02 rooms
- 113 rooms
- 64 rooms
- 45 rooms
- 36 rooms
- 67 rooms
- 88 rooms
- 19+ rooms
Owner-occupied
Renter-occupied

- Bedrooms in owner-occupied houses and condos in Pheasant Brook Estates
- 0no bedroom
- 71 bedroom
- 202 bedrooms
- 443 bedrooms
- 534 bedrooms
- 265+ bedrooms

- Bedrooms in renter-occupied apartments in Pheasant Brook Estates
- 0no bedroom
- 111 bedroom
- 82 bedrooms
- 63 bedrooms
- 94 bedrooms
- 15+ bedrooms
Average number of cars or other vehicles available in houses/condos:
Average number of cars or other vehicles available in apartments:
| This neighborhood: | 2.2 |
| Lexington: | 2.0 |
Average number of cars or other vehicles available in apartments:
| Here: | 1.6 |
| place: | 1.3 |
Percentage of units with a mortgage:
| Pheasant Brook Estates: | 70.6% |
| Lexington: | 61.9% |

- Year house built in Pheasant Brook Estates
- 82020 or later
- 202010 to 2019
- 82000 to 2009
- 241990 to 1999
- 111980 to 1989
- 81970 to 1979
- 461960 to 1969
- 191950 to 1959
- 51940 to 1949
- 161939 or earlier

City-data.com crime index for place in 2020 (higher means more crime):
| City: | 24.1 |
| U.S. average: | 219.5 |
Travel time to work (commute)
![Travel time to work (commute)]()
- 2Less than 5 minutes
- 145 to 9 minutes
- 1010 to 14 minutes
- 1615 to 19 minutes
- 1620 to 24 minutes
- 825 to 29 minutes
- 3230 to 34 minutes
- 435 to 39 minutes
- 1240 to 44 minutes
- 2245 to 59 minutes
- 560 to 89 minutes
- 190 or more minutes

Means of transportation to work
![Means of transportation to work]()
- 59.7%136Drove a car alone
- 2.6%6Carpooled
- 2.6%6Subway or elevated rail
- 1.8%4Taxi
- 0.4%1Walked
- 1.3%3Other means
- 31.6%72Worked at home

Time leaving home to go to work
![Time leaving home to go to work]()
- 112:00 a.m. to 4:59 a.m.
- 15:30 a.m. to 5:59 a.m.
- 106:00 a.m. to 6:29 a.m.
- 86:30 a.m. to 6:59 a.m.
- 257:00 a.m. to 7:29 a.m.
- 297:30 a.m. to 7:59 a.m.
- 268:00 a.m. to 8:29 a.m.
- 198:30 a.m. to 8:59 a.m.
- 89:00 a.m. to 9:59 a.m.
- 310:00 a.m. to 10:59 a.m.
- 211:00 a.m. to 11:59 a.m.
- 312:00 p.m. to 3:59 p.m.
- 24:00 p.m. to 11:59 p.m.

Occupations of males:
- Percentage of males in management occupations (except farmers):
Here: 34.8% place: 21.9%
- Percentage of males in business and financial operations occupations:
Here: 5.3% place: 9.9%
- Percentage of males in computer and mathematical occupations:
Here: 20.9% place: 14.2%
- Percentage of males in architecture and engineering occupations:
Here: 1.2% place: 5.9%
- Percentage of males in life, physical, and social science occupations:
Here: 4.5% place: 10.0%
- Percentage of males in education, training, and library occupations:
Here: 6.3% place: 8.0%
- Percentage of males in healthcare practitioners and technical occupations:
Here: 16.2% place: 7.0%
- Percentage of males in service occupations:
Here: 2.5% place: 5.4%
- Percentage of males in sales and office occupations:
Here: 6.1% place: 7.1%
- Percentage of males in production occupations:
Here: 1.0% place: 1.6%
- Percentage of males in transportation occupations:
Here: 1.2% place: 1.2%
- Percentage of males in material moving occupations:
Here: 1.9% place: 0.5%
Occupations of females:
- Percentage of females in management occupations (except farmers):
Here: 8.6% place: 15.0%
- Percentage of females in business and financial operations occupations:
Here: 21.8% place: 11.0%
- Percentage of females in computer and mathematical occupations:
Here: 9.0% place: 9.7%
- Percentage of females in architecture and engineering occupations:
Here: 3.5% place: 1.7%
- Percentage of females in life, physical, and social science occupations:
Here: 14.1% place: 9.3%
- Percentage of females in community and social services occupations:
Here: 1.5% place: 2.2%
- Percentage of females in education, training, and library occupations:
Here: 7.7% place: 11.0%
- Percentage of females in arts, design, entertainment, sports, and media occupations:
Here: 2.7% place: 4.1%
- Percentage of females in healthcare practitioners and technical occupations:
Here: 6.7% place: 10.7%
- Percentage of females in sales and office occupations:
Here: 21.8% place: 15.2%
- Percentage of females in production occupations:
Here: 2.6% place: 1.0%
Education in this neighborhood (subdivision or community):
- Percentage of people 3 years and older in K-12 schools:
Pheasant Brook Estates: 23.4% Lexington: 23.5%
- Percentage of people 3 years and older in undergraduate colleges:
Pheasant Brook Estates: 5.6% Lexington: 2.6%
- Percentage of people 3 years and older in grad. or professional schools:
Pheasant Brook Estates: 0.4% Lexington: 1.2%
- Percentage of students K-12 enrolled in private schools:
Pheasant Brook Estates: 8.9% Lexington: 10.6%
Percentage of population below poverty level:
| Pheasant Brook Estates: | 3.9% |
| Lexington: | 4.2% |
Median year owner moved in (as recorded in 2022):
| Pheasant Brook Estates: | 2004 |
| Lexington: | 2007 |
Percentage of married-couple families with both working:
| Pheasant Brook Estates: | 76.9% |
| Lexington: | 74.0% |

- 50.8%Utility gas
- 26.8%Fuel oil, kerosene, etc.
- 12.4%Electricity
- 6.6%Bottled, tank, or LP gas
- 1.2%Solar energy
- 1.1%Wood
- 1.1%Other fuel
Highways in this neighborhood:
Maple St (State Hwy 2 Alt)
Length: 0.27 miles
Direction: SW-NE
Address range: 37 to 90
Direction: SW-NE
Address range: 37 to 90
Roads and streets:
Solomon Pierce Rd
Length: 0.79 miles
Directions: E-W, N-S, SE-NW, SW-NE
Address range: 2 to 50
Directions: E-W, N-S, SE-NW, SW-NE
Address range: 2 to 50
Butterfield Rd
Length: 0.55 miles
Directions: E-W, N-S, SE-NW, SW-NE
Address range: 1 to 99
Directions: E-W, N-S, SE-NW, SW-NE
Address range: 1 to 99
Joseph Comee Rd
Length: 0.21 miles
Directions: E-W, SE-NW
Address range: 1 to 99
Directions: E-W, SE-NW
Address range: 1 to 99
Lothrop Cir
Length: 0.10 miles
Directions: E-W, SW-NE
Address range: 1 to 99
Directions: E-W, SW-NE
Address range: 1 to 99
John Hosmer Ln
Length: 0.07 miles
Directions: E-W, SW-NE
Address range: 1 to 99
Directions: E-W, SW-NE
Address range: 1 to 99
Other features:
Munroe Brk
Length: 0.27 miles
Directions: E-W, SE-NW
Directions: E-W, SE-NW