Penfield Park neighborhood in Birmingham, Alabama (AL), 35217 detailed profile
Settings
X


Business Search - 14 Million verified businesses
Area: 0.581 square miles
Population: 900
Population density:
| Penfield Park: | 1,549 people per square mile |
| Birmingham: | 1,310 people per square mile |

- 64769.4%Black
- 17318.6%Hispanic or Latino
- 667.1%White
- 333.5%Two or more races
- 131.4%American Indian

Median household income in 2022:
| Penfield Park: | $36,761 |
| Birmingham: | $39,326 |
Distribution of median household income
![Distribution of median household income]()
- 14Less than $10,000
- 71$10,000 to $19,999
- 35$20,000 to $29,999
- 78$30,000 to $39,999
- 43$40,000 to $49,999
- 26$50,000 to $59,999
- 33$60,000 to $74,999
- 25$75,000 to $99,999
- 18$100,000 to $124,999
- 38$125,000 to $149,999
- 14$150,000 to $199,999
- 32$200,000 or more

Distribution of owner-occupied house/condo value
![Distribution of owner-occupied house/condo value]()
- 48Less than $50,000
- 121$50,000 to $99,999
- 32$100,000 to $149,999
- 101$150,000 to $199,999
- 78$200,000 to $249,999
- 25$250,000 to $299,999
- 30$500,000 to $749,999

Distribution of rent paid by renters
![Distribution of rent paid by renters]()
- 63Less than $100
- 8$300 to $399
- 18$400 to $499
- 50$500 to $599
- 29$600 to $699
- 121$700 to $799
- 26$800 to $899
- 16$900 to $999
- 33$1,000 to $1,249

Median rent in 2022:
| Penfield Park: | $764 |
| Birmingham: | $753 |
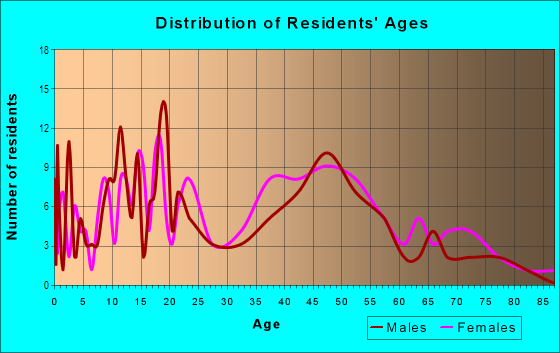
| Males: | 453 |
| Females: | 447 |
Males:
| This neighborhood: | 29.6 years |
| Whole city: | 34.5 years |
| This neighborhood: | 45.5 years |
| Whole city: | 35.9 years |
Average household size:
| Penfield Park: | 2.6 people |
| Birmingham: | 27.0 people |
Percentage of family households:
| Penfield Park: | 47.3% |
| Birmingham: | 32.5% |
| Here: | 18.4% |
| Birmingham: | 21.4% |
Percentage of married-couple families with children (among all households):
| Penfield Park: | 5.1% |
| Birmingham: | 14.3% |
Percentage of single-mother households (among all households):
| Penfield Park: | 31.7% |
| Birmingham: | 29.7% |
Percentage of never married males 15 years old and over:
Percentage of never married females 15 years old and over:
| Penfield Park: | 29.9% |
| Birmingham: | 24.0% |
Percentage of never married females 15 years old and over:
| Penfield Park: | 24.5% |
| city: | 26.4% |
Percentage of people that speak English not well or not at all:
| Penfield Park: | 0.0% |
| Birmingham: | 1.1% |
Percentage of people born in this state:
Percentage of people born in another U.S. state:
Percentage of native residents but born outside the U.S.:
Percentage of foreign born residents:
| Here: | 74.4% |
| Birmingham: | 76.8% |
Percentage of people born in another U.S. state:
| Penfield Park: | 19.8% |
| Birmingham: | 18.6% |
Percentage of native residents but born outside the U.S.:
| Here: | 2.2% |
| city: | 0.7% |
Percentage of foreign born residents:
| Here: | 5.6% |
| Birmingham: | 3.9% |

Owner-occupied
Renter-occupied


- Rooms in owner-occupied houses and condos in Penfield Park
- 01 room
- 02 rooms
- 23 rooms
- 134 rooms
- 565 rooms
- 336 rooms
- 447 rooms
- 148 rooms
- 219+ rooms

- Rooms in renter-occupied apartments in Penfield Park
- 01 room
- 32 rooms
- 03 rooms
- 1664 rooms
- 325 rooms
- 256 rooms
- 327 rooms
- 88 rooms
- 119+ rooms
Owner-occupied
Renter-occupied

- Bedrooms in owner-occupied houses and condos in Penfield Park
- 0no bedroom
- 91 bedroom
- 432 bedrooms
- 633 bedrooms
- 1084 bedrooms
- 105+ bedrooms

- Bedrooms in renter-occupied apartments in Penfield Park
- 0no bedroom
- 31 bedroom
- 1922 bedrooms
- 443 bedrooms
- 324 bedrooms
- 05+ bedrooms
Average number of cars or other vehicles available in houses/condos:
Average number of cars or other vehicles available in apartments:
| This neighborhood: | 1.5 |
| Birmingham: | 1.8 |
Average number of cars or other vehicles available in apartments:
| Here: | 1.4 |
| city: | 1.2 |
Percentage of units with a mortgage:
| Penfield Park: | 26.6% |
| Birmingham: | 51.3% |
Average estimated value of detached houses in 2022 (45.6% of all units):
| Penfield Park: | $138,260 |
| Birmingham: | $180,877 |

- Year house built in Penfield Park
- 02020 or later
- 252010 to 2019
- 172000 to 2009
- 701990 to 1999
- 481980 to 1989
- 451970 to 1979
- 1401960 to 1969
- 581950 to 1959
- 161940 to 1949
- 1191939 or earlier

City-data.com crime index for city in 2020 (higher means more crime):
| City: | 199.5 |
| U.S. average: | 219.5 |
Travel time to work (commute)
![Travel time to work (commute)]()
- 40Less than 5 minutes
- 475 to 9 minutes
- 2110 to 14 minutes
- 7515 to 19 minutes
- 14220 to 24 minutes
- 2525 to 29 minutes
- 8630 to 34 minutes
- 1035 to 39 minutes
- 440 to 44 minutes
- 4345 to 59 minutes
- 3960 to 89 minutes
- 1090 or more minutes

Means of transportation to work
![Means of transportation to work]()
- 56.7%198Drove a car alone
- 29.8%104Carpooled
- 0.3%1Bus
- 4.0%14Taxi
- 1.1%4Walked
- 9.2%32Other means
- 3.7%13Worked at home

Time leaving home to go to work
![Time leaving home to go to work]()
- 6312:00 a.m. to 4:59 a.m.
- 245:00 a.m. to 5:29 a.m.
- 345:30 a.m. to 5:59 a.m.
- 1016:00 a.m. to 6:29 a.m.
- 656:30 a.m. to 6:59 a.m.
- 607:00 a.m. to 7:29 a.m.
- 147:30 a.m. to 7:59 a.m.
- 418:00 a.m. to 8:29 a.m.
- 98:30 a.m. to 8:59 a.m.
- 249:00 a.m. to 9:59 a.m.
- 7911:00 a.m. to 11:59 a.m.
- 1512:00 p.m. to 3:59 p.m.
- 274:00 p.m. to 11:59 p.m.

Occupations of males:
- Percentage of males in management occupations (except farmers):
Here: 1.7% city: 8.1%
- Percentage of males in business and financial operations occupations:
Here: 1.1% city: 4.8%
- Percentage of males in computer and mathematical occupations:
Here: 8.1% city: 3.7%
- Percentage of males in community and social services occupations:
Here: 2.2% city: 1.5%
- Percentage of males in service occupations:
Here: 9.7% city: 17.4%
- Percentage of males in sales and office occupations:
Here: 14.6% city: 13.7%
- Percentage of males in farming, fishing, and forestry occupations:
Here: 22.2% city: 0.3%
- Percentage of males in construction, extraction, and maintenance occupations:
Here: 39.5% city: 8.3%
- Percentage of males in production occupations:
Here: 19.1% city: 8.0%
- Percentage of males in transportation occupations:
Here: 42.7% city: 6.8%
- Percentage of males in material moving occupations:
Here: 8.1% city: 9.9%
Occupations of females:
- Percentage of females in management occupations (except farmers):
Here: 3.6% city: 8.1%
- Percentage of females in business and financial operations occupations:
Here: 1.1% city: 5.7%
- Percentage of females in computer and mathematical occupations:
Here: 17.7% city: 1.3%
- Percentage of females in community and social services occupations:
Here: 17.1% city: 2.7%
- Percentage of females in healthcare practitioners and technical occupations:
Here: 2.7% city: 10.0%
- Percentage of females in service occupations:
Here: 15.2% city: 22.1%
- Percentage of females in sales and office occupations:
Here: 28.5% city: 28.0%
- Percentage of females in construction, extraction, and maintenance occupations:
Here: 14.6% city: 0.2%
- Percentage of females in production occupations:
Here: 5.9% city: 4.6%
- Percentage of females in transportation occupations:
Here: 7.0% city: 1.2%
- Percentage of females in material moving occupations:
Here: 5.5% city: 3.4%
Education in this neighborhood (subdivision or community):
- Percentage of people 3 years and older in K-12 schools:
Penfield Park: 34.0% Birmingham: 13.1%
- Percentage of people 3 years and older in undergraduate colleges:
Penfield Park: 5.9% Birmingham: 7.8%
- Percentage of people 3 years and older in grad. or professional schools:
Penfield Park: 6.3% Birmingham: 2.2%
- Percentage of students K-12 enrolled in private schools:
Penfield Park: 122.1% Birmingham: 11.1%
Percentage of population below poverty level:
| Penfield Park: | 19.2% |
| Birmingham: | 26.6% |
Median year owner moved in (as recorded in 2022):
Median year renter moved in (as recorded in 2022):
| Penfield Park: | 2013 |
| Birmingham: | 2004 |
Median year renter moved in (as recorded in 2022):
| Penfield Park: | 2018 |
| Birmingham: | 2020 |
Percentage of married-couple families with both working:
| Penfield Park: | 986.5% |
| Birmingham: | 62.9% |

- 71.3%Electricity
- 26.3%Utility gas
- 2.4%Bottled, tank, or LP gas
Roads and streets:
Co Rd 126 (Tarrant Huffman Rd, Bethel Ave)
Length: 1.02 miles
Direction: E-W
Address range: 600 to 1531
Direction: E-W
Address range: 600 to 1531
Westfield Rd
Length: 0.84 miles
Directions: E-W, N-S, SW-NE
Address range: 9400 to 9899
Directions: E-W, N-S, SW-NE
Address range: 9400 to 9899
Marshall Ave
Length: 0.68 miles
Directions: E-W, N-S, SW-NE
Address range: 400 to 9651
Directions: E-W, N-S, SW-NE
Address range: 400 to 9651
Northwood Dr
Length: 0.49 miles
Directions: E-W, N-S, SE-NW, SW-NE
Address range: 800 to 1199
Directions: E-W, N-S, SE-NW, SW-NE
Address range: 800 to 1199
Penfield Dr
Length: 0.48 miles
Directions: E-W, N-S, SW-NE
Address range: 902 to 1199
Directions: E-W, N-S, SW-NE
Address range: 902 to 1199
Westfield Ct
Length: 0.40 miles
Directions: E-W, N-S, SE-NW, SW-NE
Address range: 9808 to 9899
Directions: E-W, N-S, SE-NW, SW-NE
Address range: 9808 to 9899
Zion City Rd
Length: 0.35 miles
Directions: N-S, SE-NW
Address range: 9400 to 9703
Directions: N-S, SE-NW
Address range: 9400 to 9703
Line St (Line Dr)
Length: 0.30 miles
Direction: E-W
Address range: 1101 to 1423
Direction: E-W
Address range: 1101 to 1423
Westfield Ct (9th Ave N)
Length: 0.27 miles
Direction: N-S
Address range: 9400 to 9699
Direction: N-S
Address range: 9400 to 9699
3rd Aly N
Length: 0.22 miles
Direction: N-S
Direction: N-S
Southwood Dr
Length: 0.22 miles
Directions: E-W, N-S, SW-NE
Address range: 1000 to 1125
Directions: E-W, N-S, SW-NE
Address range: 1000 to 1125
Belmar Dr
Length: 0.21 miles
Direction: E-W
Address range: 500 to 599
Direction: E-W
Address range: 500 to 599
Westfield Pl
Length: 0.21 miles
Directions: E-W, N-S
Address range: 9700 to 9899
Directions: E-W, N-S
Address range: 9700 to 9899
Northwood St
Length: 0.21 miles
Direction: E-W
Direction: E-W
Lawson Rd (Co Rd 154)
Length: 0.20 miles
Direction: E-W
Address range: 512 to 697
Direction: E-W
Address range: 512 to 697
9th Aly N
Length: 0.18 miles
Direction: E-W
Direction: E-W
Samuel Way
Length: 0.15 miles
Direction: E-W
Address range: 500 to 599
Direction: E-W
Address range: 500 to 599
14th Aly N
Length: 0.15 miles
Directions: E-W, N-S
Directions: E-W, N-S
Virginianna Dr
Length: 0.13 miles
Direction: N-S
Address range: 9800 to 9899
Direction: N-S
Address range: 9800 to 9899
Westwood Dr
Length: 0.13 miles
Direction: N-S
Direction: N-S
14th Ave N
Length: 0.13 miles
Direction: N-S
Address range: 9400 to 9599
Direction: N-S
Address range: 9400 to 9599
7th Aly N
Length: 0.12 miles
Direction: N-S
Direction: N-S
13th Ave
Length: 0.12 miles
Direction: N-S
Address range: 9400 to 9521
Direction: N-S
Address range: 9400 to 9521
8th Ave N
Length: 0.11 miles
Direction: N-S
Address range: 9400 to 9499
Direction: N-S
Address range: 9400 to 9499
7th Ct N
Length: 0.11 miles
Direction: N-S
Direction: N-S
7th Ave N
Length: 0.11 miles
Direction: N-S
Address range: 9340 to 9499
Direction: N-S
Address range: 9340 to 9499
Wind Ave
Length: 0.10 miles
Direction: N-S
Address range: 9900 to 9999
Direction: N-S
Address range: 9900 to 9999
Jane Ann Cir
Length: 0.10 miles
Directions: E-W, N-S, SE-NW, SW-NE
Address range: 500 to 599
Directions: E-W, N-S, SE-NW, SW-NE
Address range: 500 to 599
Pope Ter
Length: 0.09 miles
Direction: N-S
Address range: 500 to 9998
Direction: N-S
Address range: 500 to 9998
1st St
Length: 0.09 miles
Direction: N-S
Direction: N-S
Westmont Ln
Length: 0.08 miles
Direction: E-W
Address range: 801 to 899
Direction: E-W
Address range: 801 to 899
Co Rd 126 (Tarrant Huffman Rd)
Length: 0.07 miles
Direction: E-W
Address range: 800 to 899
Direction: E-W
Address range: 800 to 899
20th Aly N
Length: 0.07 miles
Direction: E-W
Direction: E-W
13th Ave N
Length: 0.07 miles
Direction: N-S
Direction: N-S
21st Aly N
Length: 0.04 miles
Direction: N-S
Direction: N-S
Westfield Cir
Length: 0.03 miles
Direction: SE-NW
Address range: 800 to 899
Direction: SE-NW
Address range: 800 to 899
8th Aly N
Length: 0.01 miles
Direction: N-S
Direction: N-S