Peabody Civic Center Historic District (Peabody Civic Center) neighborhood in Peabody, Massachusetts (MA), 01960 detailed profile
Settings
X


Business Search - 14 Million verified businesses
Area: 0.096 square miles
Population: 1,200
Population density:
| Peabody Civic Center Historic District (Peabody Civic Center): | 12,465 people per square mile |
| Peabody: | 3,306 people per square mile |

- 60448.0%Hispanic or Latino
- 53942.8%White
- 554.4%Two or more races
- 493.9%Black
- 60.5%Asian
- 50.4%Some other race
- 10.08%American Indian

Median household income in 2022:
| Peabody Civic Center Historic District (Peabody Civic Center): | $89,592 |
| Peabody: | $91,125 |
Distribution of median household income
![Distribution of median household income]()
- 42Less than $10,000
- 43$10,000 to $19,999
- 62$20,000 to $29,999
- 41$30,000 to $39,999
- 20$40,000 to $49,999
- 16$50,000 to $59,999
- 46$60,000 to $74,999
- 76$75,000 to $99,999
- 91$100,000 to $124,999
- 69$125,000 to $149,999
- 89$150,000 to $199,999
- 21$200,000 or more

Distribution of owner-occupied house/condo value
![Distribution of owner-occupied house/condo value]()
- 6Less than $50,000
- 2$50,000 to $99,999
- 3$100,000 to $149,999
- 3$150,000 to $199,999
- 7$200,000 to $249,999
- 15$250,000 to $299,999
- 85$300,000 to $399,999
- 44$400,000 to $499,999
- 105$500,000 to $749,999
- 3$750,000 to $999,999
- 20$1,000,000 or more

Distribution of rent paid by renters
![Distribution of rent paid by renters]()
- 8Less than $100
- 23$100 to $199
- 11$200 to $299
- 41$300 to $399
- 41$400 to $499
- 30$500 to $599
- 56$600 to $699
- 10$700 to $799
- 10$800 to $899
- 11$900 to $999
- 51$1,000 to $1,249
- 20$1,250 to $1,499
- 99$1,500 to $1,999
- 32$2,000 or more

Median rent in 2022:
| Peabody Civic Center Historic District (Peabody Civic Center): | $1,126 |
| Peabody: | $1,731 |
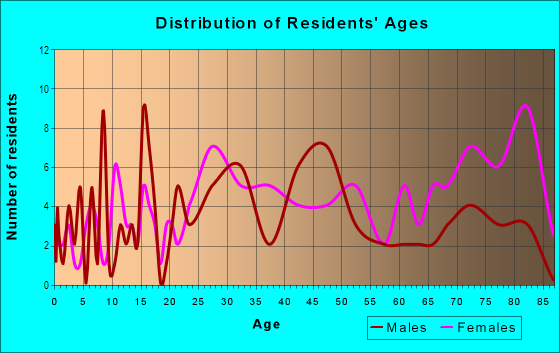
| Males: | 593 |
| Females: | 607 |
Males:
| This neighborhood: | 41.6 years |
| Whole city: | 44.3 years |
| This neighborhood: | 33.3 years |
| Whole city: | 48.8 years |
Average household size:
| Peabody Civic Center Historic District (Peabody Civic Center): | 2.3 people |
| Peabody: | 2.4 people |
Percentage of family households:
| Peabody Civic Center Historic District (Peabody Civic Center): | 58.3% |
| Peabody: | 40.7% |
| Here: | 42.9% |
| Peabody: | 47.0% |
Percentage of married-couple families with children (among all households):
| Peabody Civic Center Historic District (Peabody Civic Center): | 30.0% |
| Peabody: | 32.8% |
Percentage of single-mother households (among all households):
| Peabody Civic Center Historic District (Peabody Civic Center): | 7.9% |
| Peabody: | 6.7% |
Percentage of never married males 15 years old and over:
Percentage of never married females 15 years old and over:
| Peabody Civic Center Historic District (Peabody Civic Center): | 15.0% |
| Peabody: | 15.3% |
Percentage of never married females 15 years old and over:
| Peabody Civic Center Historic District (Peabody Civic Center): | 18.7% |
| city: | 13.2% |
Percentage of people that speak English not well or not at all:
| Peabody Civic Center Historic District (Peabody Civic Center): | 25.8% |
| Peabody: | 5.1% |
Percentage of people born in this state:
Percentage of people born in another U.S. state:
Percentage of native residents but born outside the U.S.:
Percentage of foreign born residents:
| Here: | 51.9% |
| Peabody: | 72.1% |
Percentage of people born in another U.S. state:
| Peabody Civic Center Historic District (Peabody Civic Center): | 9.0% |
| Peabody: | 10.1% |
Percentage of native residents but born outside the U.S.:
| Here: | 5.1% |
| city: | 1.4% |
Percentage of foreign born residents:
| Here: | 34.0% |
| Peabody: | 16.3% |

Owner-occupied
Renter-occupied


- Rooms in owner-occupied houses and condos in Peabody Civic Center Historic District <
> - 01 room
- 22 rooms
- 83 rooms
- 794 rooms
- 645 rooms
- 536 rooms
- 137 rooms
- 768 rooms
- 109+ rooms

- Rooms in renter-occupied apartments in Peabody Civic Center Historic District <
> - 231 room
- 692 rooms
- 413 rooms
- 624 rooms
- 485 rooms
- 386 rooms
- 167 rooms
- 08 rooms
- 99+ rooms
Owner-occupied
Renter-occupied

- Bedrooms in owner-occupied houses and condos in Peabody Civic Center Historic District <
> - 0no bedroom
- 181 bedroom
- 622 bedrooms
- 1223 bedrooms
- 1124 bedrooms
- 95+ bedrooms

- Bedrooms in renter-occupied apartments in Peabody Civic Center Historic District <
> - 23no bedroom
- 1491 bedroom
- 822 bedrooms
- 623 bedrooms
- 74 bedrooms
- 95+ bedrooms
Average number of cars or other vehicles available in houses/condos:
Average number of cars or other vehicles available in apartments:
| This neighborhood: | 1.6 |
| Peabody: | 2.0 |
Average number of cars or other vehicles available in apartments:
| Here: | 1.2 |
| city: | 1.2 |
Percentage of units with a mortgage:
| Peabody Civic Center Historic District (Peabody Civic Center): | 81.7% |
| Peabody: | 64.1% |
Housing prices:
- Average estimated value of detached houses in 2022 (34.3% of all units):
Peabody Civic Center Historic District (Peabody Civic Center): $510,606 Peabody: $579,174
- Average estimated value of housing units in 2-unit structures in 2022 (31.2% of all units):
This neighborhood: $407,733 Peabody: $476,618

- Year house built in Peabody Civic Center Historic District <
> - 02020 or later
- 462010 to 2019
- 1142000 to 2009
- 241990 to 1999
- 221980 to 1989
- 241970 to 1979
- 541960 to 1969
- 211950 to 1959
- 101940 to 1949
- 2831939 or earlier

City-data.com crime index for city in 2020 (higher means more crime):
| City: | 96.6 |
| U.S. average: | 219.5 |
Travel time to work (commute)
![Travel time to work (commute)]()
- 11Less than 5 minutes
- 585 to 9 minutes
- 9310 to 14 minutes
- 9715 to 19 minutes
- 9920 to 24 minutes
- 4125 to 29 minutes
- 8530 to 34 minutes
- 2235 to 39 minutes
- 840 to 44 minutes
- 4945 to 59 minutes
- 4360 to 89 minutes
- 1290 or more minutes

Means of transportation to work
![Means of transportation to work]()
- 53.2%344Drove a car alone
- 32.3%209Carpooled
- 2.0%13Bus
- 0.5%3Subway or elevated rail
- 7.1%46Long-distance train or commuter rail
- 2.2%14Taxi
- 0.3%2Bicycle
- 8.0%52Walked
- 5.9%38Other means
- 3.6%23Worked at home

Time leaving home to go to work
![Time leaving home to go to work]()
- 3412:00 a.m. to 4:59 a.m.
- 125:00 a.m. to 5:29 a.m.
- 365:30 a.m. to 5:59 a.m.
- 666:00 a.m. to 6:29 a.m.
- 726:30 a.m. to 6:59 a.m.
- 807:00 a.m. to 7:29 a.m.
- 357:30 a.m. to 7:59 a.m.
- 868:00 a.m. to 8:29 a.m.
- 458:30 a.m. to 8:59 a.m.
- 409:00 a.m. to 9:59 a.m.
- 1210:00 a.m. to 10:59 a.m.
- 2211:00 a.m. to 11:59 a.m.
- 7412:00 p.m. to 3:59 p.m.
- 84:00 p.m. to 11:59 p.m.

Occupations of males:
- Percentage of males in management occupations (except farmers):
Here: 4.3% city: 12.1%
- Percentage of males in business and financial operations occupations:
Here: 3.7% city: 4.5%
- Percentage of males in computer and mathematical occupations:
Here: 2.5% city: 4.4%
- Percentage of males in architecture and engineering occupations:
Here: 4.2% city: 2.5%
- Percentage of males in arts, design, entertainment, sports, and media occupations:
Here: 1.6% city: 1.6%
- Percentage of males in service occupations:
Here: 22.6% city: 17.0%
- Percentage of males in sales and office occupations:
Here: 16.7% city: 19.3%
- Percentage of males in construction, extraction, and maintenance occupations:
Here: 13.7% city: 8.7%
- Percentage of males in production occupations:
Here: 8.9% city: 6.6%
- Percentage of males in transportation occupations:
Here: 11.8% city: 6.0%
- Percentage of males in material moving occupations:
Here: 9.8% city: 2.7%
Occupations of females:
- Percentage of females in management occupations (except farmers):
Here: 2.2% city: 8.5%
- Percentage of females in business and financial operations occupations:
Here: 9.0% city: 7.8%
- Percentage of females in community and social services occupations:
Here: 1.7% city: 1.8%
- Percentage of females in arts, design, entertainment, sports, and media occupations:
Here: 3.9% city: 1.6%
- Percentage of females in healthcare practitioners and technical occupations:
Here: 15.6% city: 14.1%
- Percentage of females in service occupations:
Here: 40.5% city: 19.9%
- Percentage of females in sales and office occupations:
Here: 26.7% city: 27.9%
Education in this neighborhood (subdivision or community):
- Percentage of people 3 years and older in K-12 schools:
Peabody Civic Center Historic District (Peabody Civic Center): 20.7% Peabody: 12.8%
- Percentage of people 3 years and older in undergraduate colleges:
Peabody Civic Center Historic District (Peabody Civic Center): 12.1% Peabody: 3.7%
- Percentage of people 3 years and older in grad. or professional schools:
Peabody Civic Center Historic District (Peabody Civic Center): 6.0% Peabody: 1.4%
- Percentage of students K-12 enrolled in private schools:
Peabody Civic Center Historic District (Peabody Civic Center): 15.3% Peabody: 14.5%
Percentage of population below poverty level:
| Peabody Civic Center Historic District (Peabody Civic Center): | 9.8% |
| Peabody: | 7.0% |
Median year owner moved in (as recorded in 2022):
Median year renter moved in (as recorded in 2022):
| Peabody Civic Center Historic District (Peabody Civic Center): | 2011 |
| Peabody: | 2003 |
Median year renter moved in (as recorded in 2022):
| Peabody Civic Center Historic District (Peabody Civic Center): | 2015 |
| Peabody: | 2015 |
Percentage of married-couple families with both working:
| Peabody Civic Center Historic District (Peabody Civic Center): | 111.2% |
| Peabody: | 78.4% |

- 63.7%Utility gas
- 17.4%Electricity
- 12.1%Fuel oil, kerosene, etc.
- 2.9%No fuel used
- 2.2%Bottled, tank, or LP gas
- 1.0%Other fuel
- 0.7%Wood
Roads and streets:
Lowell St
Length: 0.38 miles
Directions: E-W, SE-NW
Address range: 4 to 106
Directions: E-W, SE-NW
Address range: 4 to 106
Chestnut St
Length: 0.35 miles
Directions: E-W, SW-NE
Address range: 1 to 99
Directions: E-W, SW-NE
Address range: 1 to 99
Franklin St
Length: 0.34 miles
Direction: SE-NW
Address range: 2 to 62
Direction: SE-NW
Address range: 2 to 62
Railroad Ave
Length: 0.24 miles
Directions: E-W, SE-NW
Address range: 1 to 99
Directions: E-W, SE-NW
Address range: 1 to 99
Church St
Length: 0.17 miles
Directions: SE-NW, SW-NE
Address range: 1 to 99
Directions: SE-NW, SW-NE
Address range: 1 to 99
Seamount Rd
Length: 0.16 miles
Directions: N-S, SE-NW, SW-NE
Address range: 1 to 9
Directions: N-S, SE-NW, SW-NE
Address range: 1 to 9
Foster St
Length: 0.16 miles
Direction: SW-NE
Address range: 1 to 57
Direction: SW-NE
Address range: 1 to 57
Perkins St
Length: 0.13 miles
Directions: E-W, SW-NE
Address range: 4 to 27
Directions: E-W, SW-NE
Address range: 4 to 27
School St
Length: 0.12 miles
Direction: SW-NE
Address range: 1 to 99
Direction: SW-NE
Address range: 1 to 99
N377
Length: 0.12 miles
Directions: N-S, SE-NW, SW-NE
Directions: N-S, SE-NW, SW-NE
Coolidge Rd
Length: 0.11 miles
Direction: SE-NW
Address range: 1 to 99
Direction: SE-NW
Address range: 1 to 99
Walker Rd
Length: 0.10 miles
Direction: SW-NE
Address range: 1 to 99
Direction: SW-NE
Address range: 1 to 99
Sawyer St
Length: 0.09 miles
Direction: SW-NE
Address range: 50 to 99
Direction: SW-NE
Address range: 50 to 99
Central St
Length: 0.08 miles
Directions: N-S, SW-NE
Directions: N-S, SW-NE
Perkins Way
Length: 0.07 miles
Direction: SE-NW
Address range: 1 to 99
Direction: SE-NW
Address range: 1 to 99
Basford Ct
Length: 0.07 miles
Direction: SE-NW
Address range: 1 to 99
Direction: SE-NW
Address range: 1 to 99
Peabody Sq
Length: 0.05 miles
Direction: E-W
Address range: 1 to 99
Direction: E-W
Address range: 1 to 99
Railroad features:
Boston and Maine RR
Length: 0.66 miles
Directions: E-W, SE-NW, SW-NE
Directions: E-W, SE-NW, SW-NE
Other features:
Proctor Brk
Length: 0.29 miles
Directions: E-W, SE-NW
Directions: E-W, SE-NW