Oriens Park neighborhood in Austin, Texas (TX), 78723 detailed profile
Settings
X


Business Search - 14 Million verified businesses
Area: 0.676 square miles
Population: 2,257
Population density:
| Oriens Park: | 3,341 people per square mile |
| Austin: | 3,878 people per square mile |

- 84837.6%Black
- 77034.1%Hispanic or Latino
- 41018.2%White
- 1577.0%Asian
- 703.1%Two or more races

Median household income in 2022:
| Oriens Park: | $68,007 |
| Austin: | $89,415 |
Distribution of median household income
![Distribution of median household income]()
- 136Less than $10,000
- 173$10,000 to $19,999
- 58$20,000 to $29,999
- 55$30,000 to $39,999
- 75$40,000 to $49,999
- 131$50,000 to $59,999
- 24$60,000 to $74,999
- 110$75,000 to $99,999
- 99$100,000 to $124,999
- 62$125,000 to $149,999
- 64$150,000 to $199,999
- 68$200,000 or more

Distribution of owner-occupied house/condo value
![Distribution of owner-occupied house/condo value]()
- 137Less than $50,000
- 27$50,000 to $99,999
- 30$150,000 to $199,999
- 65$200,000 to $249,999
- 55$250,000 to $299,999
- 84$300,000 to $399,999
- 66$400,000 to $499,999
- 124$500,000 to $749,999
- 13$750,000 to $999,999
- 8$1,000,000 or more

Distribution of rent paid by renters
![Distribution of rent paid by renters]()
- 90Less than $100
- 80$100 to $199
- 50$200 to $299
- 78$600 to $699
- 52$800 to $899
- 40$900 to $999
- 183$1,000 to $1,249
- 76$1,250 to $1,499
- 57$1,500 to $1,999
- 78$2,000 or more

Median rent in 2022:
| Oriens Park: | $1,138 |
| Austin: | $1,437 |
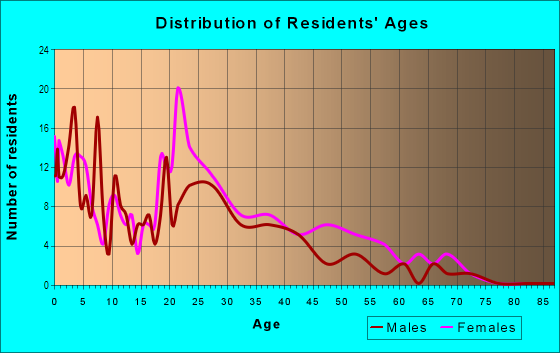
| Males: | 1,271 |
| Females: | 985 |
Males:
| This neighborhood: | 32.7 years |
| Whole city: | 34.5 years |
| This neighborhood: | 35.1 years |
| Whole city: | 34.4 years |
Average household size:
| Oriens Park: | 2.5 people |
| Austin: | 28.0 people |
Percentage of family households:
| Oriens Park: | 29.0% |
| Austin: | 36.6% |
| Here: | 19.3% |
| Austin: | 35.3% |
Percentage of married-couple families with children (among all households):
| Oriens Park: | 26.2% |
| Austin: | 36.3% |
Percentage of single-mother households (among all households):
| Oriens Park: | 17.0% |
| Austin: | 7.9% |
Percentage of never married males 15 years old and over:
Percentage of never married females 15 years old and over:
| Oriens Park: | 26.7% |
| Austin: | 25.0% |
Percentage of never married females 15 years old and over:
| Oriens Park: | 27.4% |
| city: | 19.9% |
Percentage of people that speak English not well or not at all:
| Oriens Park: | 8.2% |
| Austin: | 5.2% |
Percentage of people born in this state:
Percentage of people born in another U.S. state:
Percentage of native residents but born outside the U.S.:
Percentage of foreign born residents:
| Here: | 61.7% |
| Austin: | 48.2% |
Percentage of people born in another U.S. state:
| Oriens Park: | 22.4% |
| Austin: | 31.8% |
Percentage of native residents but born outside the U.S.:
| Here: | 0.6% |
| city: | 2.3% |
Percentage of foreign born residents:
| Here: | 15.3% |
| Austin: | 17.8% |

Owner-occupied
Renter-occupied


- Rooms in owner-occupied houses and condos in Oriens Park
- 01 room
- 02 rooms
- 53 rooms
- 1164 rooms
- 1105 rooms
- 566 rooms
- 817 rooms
- 218 rooms
- 219+ rooms

- Rooms in renter-occupied apartments in Oriens Park
- 501 room
- 772 rooms
- 793 rooms
- 2114 rooms
- 495 rooms
- 966 rooms
- 57 rooms
- 108 rooms
- 09+ rooms
Owner-occupied
Renter-occupied

- Bedrooms in owner-occupied houses and condos in Oriens Park
- 0no bedroom
- 431 bedroom
- 102 bedrooms
- 2923 bedrooms
- 974 bedrooms
- 125+ bedrooms

- Bedrooms in renter-occupied apartments in Oriens Park
- 50no bedroom
- 1841 bedroom
- 2182 bedrooms
- 1013 bedrooms
- 264 bedrooms
- 05+ bedrooms
Average number of cars or other vehicles available in houses/condos:
Average number of cars or other vehicles available in apartments:
| This neighborhood: | 1.9 |
| Austin: | 1.9 |
Average number of cars or other vehicles available in apartments:
| Here: | 1.1 |
| city: | 1.3 |
Percentage of units with a mortgage:
| Oriens Park: | 70.4% |
| Austin: | 68.5% |
Average estimated value of detached houses in 2022 (54.7% of all units):
| Oriens Park: | $416,268 |
| Austin: | $737,673 |

- Year house built in Oriens Park
- 272020 or later
- 2662010 to 2019
- 1752000 to 2009
- 351990 to 1999
- 2311980 to 1989
- 1691970 to 1979
- 2381960 to 1969
- 461950 to 1959
- 01940 to 1949
- 01939 or earlier

City-data.com crime index for city in 2020 (higher means more crime):
| City: | 316.8 |
| U.S. average: | 219.5 |
Travel time to work (commute)
![Travel time to work (commute)]()
- 33Less than 5 minutes
- 345 to 9 minutes
- 9710 to 14 minutes
- 16315 to 19 minutes
- 14720 to 24 minutes
- 16525 to 29 minutes
- 6730 to 34 minutes
- 635 to 39 minutes
- 1640 to 44 minutes
- 2545 to 59 minutes
- 10460 to 89 minutes
- 19890 or more minutes

Means of transportation to work
![Means of transportation to work]()
- 72.2%915Drove a car alone
- 8.4%106Carpooled
- 4.4%56Bus
- 0.9%11Taxi
- 3.4%43Motorcycle
- 2.5%32Bicycle
- 0.3%4Other means
- 14.6%185Worked at home

Time leaving home to go to work
![Time leaving home to go to work]()
- 4712:00 a.m. to 4:59 a.m.
- 385:00 a.m. to 5:29 a.m.
- 105:30 a.m. to 5:59 a.m.
- 536:00 a.m. to 6:29 a.m.
- 356:30 a.m. to 6:59 a.m.
- 1357:00 a.m. to 7:29 a.m.
- 457:30 a.m. to 7:59 a.m.
- 1038:00 a.m. to 8:29 a.m.
- 248:30 a.m. to 8:59 a.m.
- 559:00 a.m. to 9:59 a.m.
- 3010:00 a.m. to 10:59 a.m.
- 1111:00 a.m. to 11:59 a.m.
- 14812:00 p.m. to 3:59 p.m.
- 1324:00 p.m. to 11:59 p.m.

Occupations of males:
- Percentage of males in management occupations (except farmers):
Here: 6.8% city: 15.3%
- Percentage of males in business and financial operations occupations:
Here: 1.8% city: 7.0%
- Percentage of males in computer and mathematical occupations:
Here: 9.1% city: 12.0%
- Percentage of males in architecture and engineering occupations:
Here: 4.4% city: 5.1%
- Percentage of males in life, physical, and social science occupations:
Here: 1.8% city: 1.3%
- Percentage of males in legal occupations:
Here: 2.1% city: 1.9%
- Percentage of males in arts, design, entertainment, sports, and media occupations:
Here: 3.2% city: 4.1%
- Percentage of males in healthcare practitioners and technical occupations:
Here: 8.6% city: 2.3%
- Percentage of males in service occupations:
Here: 11.8% city: 11.2%
- Percentage of males in sales and office occupations:
Here: 13.3% city: 14.9%
- Percentage of males in construction, extraction, and maintenance occupations:
Here: 7.0% city: 7.1%
- Percentage of males in production occupations:
Here: 11.1% city: 3.4%
- Percentage of males in material moving occupations:
Here: 11.5% city: 2.8%
Occupations of females:
- Percentage of females in management occupations (except farmers):
Here: 6.8% city: 13.5%
- Percentage of females in business and financial operations occupations:
Here: 6.2% city: 11.0%
- Percentage of females in architecture and engineering occupations:
Here: 2.2% city: 1.6%
- Percentage of females in community and social services occupations:
Here: 2.2% city: 2.2%
- Percentage of females in education, training, and library occupations:
Here: 4.3% city: 9.0%
- Percentage of females in arts, design, entertainment, sports, and media occupations:
Here: 16.3% city: 4.5%
- Percentage of females in healthcare practitioners and technical occupations:
Here: 8.1% city: 7.8%
- Percentage of females in service occupations:
Here: 30.3% city: 15.8%
- Percentage of females in sales and office occupations:
Here: 20.8% city: 22.9%
- Percentage of females in transportation occupations:
Here: 1.9% city: 0.8%
Education in this neighborhood (subdivision or community):
- Percentage of people 3 years and older in K-12 schools:
Oriens Park: 15.5% Austin: 12.4%
- Percentage of people 3 years and older in undergraduate colleges:
Oriens Park: 10.2% Austin: 6.1%
- Percentage of people 3 years and older in grad. or professional schools:
Oriens Park: 5.0% Austin: 2.5%
- Percentage of students K-12 enrolled in private schools:
Oriens Park: 27.1% Austin: 11.8%
Percentage of population below poverty level:
| Oriens Park: | 20.5% |
| Austin: | 11.1% |
Median year owner moved in (as recorded in 2022):
Median year renter moved in (as recorded in 2022):
| Oriens Park: | 2011 |
| Austin: | 2013 |
Median year renter moved in (as recorded in 2022):
| Oriens Park: | 2013 |
| Austin: | 2021 |
Percentage of married-couple families with both working:
| Oriens Park: | 333.3% |
| Austin: | 68.5% |

- 51.0%Electricity
- 44.1%Utility gas
- 3.4%No fuel used
- 1.5%Bottled, tank, or LP gas
Highways in this neighborhood:
US Hwy 183 (Ed Bluestein Blvd)
Length: 0.41 miles
Directions: N-S, SE-NW, SW-NE
Address range: 5160 to 5470
Directions: N-S, SE-NW, SW-NE
Address range: 5160 to 5470
Roads and streets:
E 51st St
Length: 1.39 miles
Directions: E-W, SE-NW, SW-NE
Directions: E-W, SE-NW, SW-NE
Eastern Pkwy
Length: 0.28 miles
Direction: N-S
Address range: 5200 to 5499
Direction: N-S
Address range: 5200 to 5499
Rangoon Rd
Length: 0.20 miles
Directions: N-S, SW-NE
Address range: 5400 to 5599
Directions: N-S, SW-NE
Address range: 5400 to 5599
Mandalay Dr
Length: 0.16 miles
Directions: E-W, SE-NW
Address range: 5400 to 5599
Directions: E-W, SE-NW
Address range: 5400 to 5599
Other features:
Little Walnut Crk
Length: 0.07 miles
Directions: N-S, SE-NW
Directions: N-S, SE-NW