Olde Towne North neighborhood in Peoria, Illinois (IL), 61603 detailed profile
Settings
X


Business Search - 14 Million verified businesses
Area: 0.565 square miles
Population: 921
Population density:
| Olde Towne North: | 1,629 people per square mile |
| Peoria: | 2,460 people per square mile |

- 35734.6%Black
- 34633.5%White
- 15114.6%Hispanic or Latino
- 12011.6%Asian
- 424.1%Two or more races
- 141.4%Native Hawaiian and Other
Pacific Islander - 30.3%American Indian

Distribution of median household income
![Distribution of median household income]()
- 97Less than $10,000
- 77$10,000 to $19,999
- 64$20,000 to $29,999
- 97$30,000 to $39,999
- 69$40,000 to $49,999
- 43$50,000 to $59,999
- 48$60,000 to $74,999
- 45$75,000 to $99,999
- 7$100,000 to $124,999
- 41$125,000 to $149,999
- 20$150,000 to $199,999
- 82$200,000 or more

Distribution of owner-occupied house/condo value
![Distribution of owner-occupied house/condo value]()
- 85Less than $50,000
- 117$50,000 to $99,999
- 26$100,000 to $149,999
- 76$150,000 to $199,999
- 111$200,000 to $249,999
- 75$250,000 to $299,999
- 61$300,000 to $399,999
- 11$400,000 to $499,999

Distribution of rent paid by renters
![Distribution of rent paid by renters]()
- 107Less than $100
- 33$100 to $199
- 94$200 to $299
- 72$300 to $399
- 61$400 to $499
- 81$500 to $599
- 64$600 to $699
- 51$700 to $799
- 41$800 to $899
- 80$900 to $999
- 11$1,000 to $1,249
- 139$1,250 to $1,499
- 75$1,500 to $1,999

Median rent in 2022:
| Olde Towne North: | $600 |
| Peoria: | $696 |
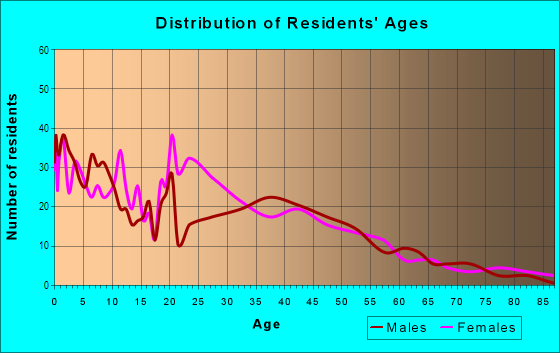
| Males: | 535 |
| Females: | 385 |
Males:
| This neighborhood: | 32.8 years |
| Whole city: | 33.8 years |
| This neighborhood: | 41.8 years |
| Whole city: | 36.0 years |
Average household size:
| Olde Towne North: | 2.4 people |
| Peoria: | 2.2 people |
Percentage of family households:
| Olde Towne North: | 23.3% |
| Peoria: | 41.0% |
| Here: | 11.1% |
| Peoria: | 33.8% |
Percentage of married-couple families with children (among all households):
| Olde Towne North: | 6.9% |
| Peoria: | 22.1% |
Percentage of single-mother households (among all households):
| Olde Towne North: | 46.7% |
| Peoria: | 16.8% |
Percentage of never married males 15 years old and over:
Percentage of never married females 15 years old and over:
| Olde Towne North: | 41.1% |
| Peoria: | 19.6% |
Percentage of never married females 15 years old and over:
| Olde Towne North: | 24.1% |
| city: | 19.0% |
Percentage of people that speak English not well or not at all:
| Olde Towne North: | 6.9% |
| Peoria: | 1.6% |
Percentage of people born in this state:
Percentage of people born in another U.S. state:
Percentage of native residents but born outside the U.S.:
Percentage of foreign born residents:
| Here: | 77.6% |
| Peoria: | 72.0% |
Percentage of people born in another U.S. state:
| Olde Towne North: | 16.3% |
| Peoria: | 18.8% |
Percentage of native residents but born outside the U.S.:
| Here: | 2.9% |
| city: | 1.4% |
Percentage of foreign born residents:
| Here: | 4.7% |
| Peoria: | 7.8% |

Owner-occupied
Renter-occupied


- Rooms in owner-occupied houses and condos in Olde Towne North
- 81 room
- 312 rooms
- 1063 rooms
- 644 rooms
- 335 rooms
- 166 rooms
- 87 rooms
- 138 rooms
- 249+ rooms

- Rooms in renter-occupied apartments in Olde Towne North
- 681 room
- 1862 rooms
- 713 rooms
- 784 rooms
- 415 rooms
- 596 rooms
- 147 rooms
- 228 rooms
- 149+ rooms
Owner-occupied
Renter-occupied

- Bedrooms in owner-occupied houses and condos in Olde Towne North
- 8no bedroom
- 1591 bedroom
- 502 bedrooms
- 433 bedrooms
- 74 bedrooms
- 155+ bedrooms

- Bedrooms in renter-occupied apartments in Olde Towne North
- 74no bedroom
- 1221 bedroom
- 842 bedrooms
- 623 bedrooms
- 194 bedrooms
- 225+ bedrooms
Average number of cars or other vehicles available in houses/condos:
Average number of cars or other vehicles available in apartments:
| This neighborhood: | 1.6 |
| Peoria: | 1.8 |
Average number of cars or other vehicles available in apartments:
| Here: | 0.7 |
| city: | 1.1 |
Percentage of units with a mortgage:
| Olde Towne North: | 42.9% |
| Peoria: | 63.0% |
Average estimated value of detached houses in 2022 (32.4% of all units):
| Olde Towne North: | $71,421 |
| Peoria: | $191,429 |

- Year house built in Olde Towne North
- 92020 or later
- 162010 to 2019
- 182000 to 2009
- 491990 to 1999
- 1101980 to 1989
- 771970 to 1979
- 261960 to 1969
- 831950 to 1959
- 671940 to 1949
- 3001939 or earlier

City-data.com crime index for city in 2020 (higher means more crime):
| City: | 443.5 |
| U.S. average: | 219.5 |
Travel time to work (commute)
![Travel time to work (commute)]()
- 22Less than 5 minutes
- 815 to 9 minutes
- 10610 to 14 minutes
- 6615 to 19 minutes
- 8220 to 24 minutes
- 2225 to 29 minutes
- 2430 to 34 minutes
- 1845 to 59 minutes
- 1660 to 89 minutes
- 390 or more minutes

Means of transportation to work
![Means of transportation to work]()
- 57.6%162Drove a car alone
- 24.9%70Carpooled
- 8.2%23Bus
- 2.5%7Taxi
- 1.1%3Bicycle
- 18.5%52Walked
- 25.2%71Worked at home

Time leaving home to go to work
![Time leaving home to go to work]()
- 2812:00 a.m. to 4:59 a.m.
- 65:00 a.m. to 5:29 a.m.
- 185:30 a.m. to 5:59 a.m.
- 386:00 a.m. to 6:29 a.m.
- 366:30 a.m. to 6:59 a.m.
- 387:00 a.m. to 7:29 a.m.
- 617:30 a.m. to 7:59 a.m.
- 548:00 a.m. to 8:29 a.m.
- 328:30 a.m. to 8:59 a.m.
- 79:00 a.m. to 9:59 a.m.
- 1510:00 a.m. to 10:59 a.m.
- 911:00 a.m. to 11:59 a.m.
- 4512:00 p.m. to 3:59 p.m.
- 684:00 p.m. to 11:59 p.m.

Occupations of males:
- Percentage of males in management occupations (except farmers):
Here: 8.3% city: 11.1%
- Percentage of males in business and financial operations occupations:
Here: 1.6% city: 4.5%
- Percentage of males in computer and mathematical occupations:
Here: 2.9% city: 6.1%
- Percentage of males in architecture and engineering occupations:
Here: 9.6% city: 9.0%
- Percentage of males in community and social services occupations:
Here: 1.3% city: 1.3%
- Percentage of males in legal occupations:
Here: 3.0% city: 1.2%
- Percentage of males in education, training, and library occupations:
Here: 2.9% city: 3.7%
- Percentage of males in healthcare practitioners and technical occupations:
Here: 3.7% city: 4.7%
- Percentage of males in service occupations:
Here: 18.8% city: 15.9%
- Percentage of males in sales and office occupations:
Here: 3.2% city: 12.1%
- Percentage of males in construction, extraction, and maintenance occupations:
Here: 16.8% city: 5.4%
- Percentage of males in production occupations:
Here: 8.5% city: 7.6%
- Percentage of males in transportation occupations:
Here: 6.2% city: 5.1%
- Percentage of males in material moving occupations:
Here: 12.4% city: 6.4%
Occupations of females:
- Percentage of females in management occupations (except farmers):
Here: 7.3% city: 8.2%
- Percentage of females in business and financial operations occupations:
Here: 5.8% city: 3.9%
- Percentage of females in computer and mathematical occupations:
Here: 3.3% city: 1.2%
- Percentage of females in life, physical, and social science occupations:
Here: 1.7% city: 1.4%
- Percentage of females in community and social services occupations:
Here: 2.0% city: 3.4%
- Percentage of females in education, training, and library occupations:
Here: 9.1% city: 9.3%
- Percentage of females in healthcare practitioners and technical occupations:
Here: 15.1% city: 14.9%
- Percentage of females in service occupations:
Here: 18.6% city: 24.2%
- Percentage of females in sales and office occupations:
Here: 18.9% city: 23.2%
- Percentage of females in production occupations:
Here: 7.6% city: 2.4%
- Percentage of females in material moving occupations:
Here: 10.5% city: 2.4%
Education in this neighborhood (subdivision or community):
- Percentage of people 3 years and older in K-12 schools:
Olde Towne North: 27.4% Peoria: 17.8%
- Percentage of people 3 years and older in undergraduate colleges:
Olde Towne North: 11.8% Peoria: 7.5%
- Percentage of people 3 years and older in grad. or professional schools:
Olde Towne North: 24.7% Peoria: 2.5%
- Percentage of students K-12 enrolled in private schools:
Olde Towne North: 3.3% Peoria: 16.0%
Percentage of population below poverty level:
| Olde Towne North: | 43.2% |
| Peoria: | 17.4% |
Median year owner moved in (as recorded in 2022):
Median year renter moved in (as recorded in 2022):
| Olde Towne North: | 2003 |
| Peoria: | 2013 |
Median year renter moved in (as recorded in 2022):
| Olde Towne North: | 2015 |
| Peoria: | 2020 |
Percentage of married-couple families with both working:
| Olde Towne North: | 33.2% |
| Peoria: | 71.4% |

- 57.8%Utility gas
- 35.0%Electricity
- 3.6%Wood
- 2.2%Bottled, tank, or LP gas
- 1.4%No fuel used
Highways in this neighborhood:
State Rte 29 (US Hwy 24, NE Adams St)
Length: 0.77 miles
Direction: SW-NE
Address range: 430 to 1279
Direction: SW-NE
Address range: 430 to 1279
Roads and streets:
Wayne St
Length: 0.82 miles
Directions: N-S, SE-NW
Address range: 100 to 999
Directions: N-S, SE-NW
Address range: 100 to 999
Hancock St
Length: 0.73 miles
Directions: E-W, N-S, SE-NW, SW-NE
Address range: 200 to 799
Directions: E-W, N-S, SE-NW, SW-NE
Address range: 200 to 799
NE Glendale Ave
Length: 0.69 miles
Direction: SW-NE
Address range: 500 to 1198
Direction: SW-NE
Address range: 500 to 1198
NE Perry Ave
Length: 0.69 miles
Direction: SW-NE
Address range: 500 to 1199
Direction: SW-NE
Address range: 500 to 1199
NE Jefferson Ave
Length: 0.69 miles
Direction: SW-NE
Address range: 500 to 1199
Direction: SW-NE
Address range: 500 to 1199
NE Monroe St
Length: 0.69 miles
Direction: SW-NE
Address range: 500 to 1199
Direction: SW-NE
Address range: 500 to 1199
NE Madison Ave
Length: 0.69 miles
Direction: SW-NE
Address range: 500 to 1199
Direction: SW-NE
Address range: 500 to 1199
Morton St
Length: 0.64 miles
Direction: SE-NW
Address range: 100 to 799
Direction: SE-NW
Address range: 100 to 799
NE Water St
Length: 0.64 miles
Direction: SW-NE
Address range: 500 to 1099
Direction: SW-NE
Address range: 500 to 1099
Morgan St
Length: 0.58 miles
Direction: SE-NW
Address range: 100 to 799
Direction: SE-NW
Address range: 100 to 799
Evans St
Length: 0.58 miles
Direction: SE-NW
Address range: 200 to 799
Direction: SE-NW
Address range: 200 to 799
Voris St
Length: 0.58 miles
Direction: SE-NW
Address range: 200 to 799
Direction: SE-NW
Address range: 200 to 799
Green St
Length: 0.56 miles
Directions: N-S, SE-NW
Address range: 200 to 799
Directions: N-S, SE-NW
Address range: 200 to 799
NE Greenleaf St
Length: 0.55 miles
Directions: E-W, SW-NE
Address range: 300 to 918
Directions: E-W, SW-NE
Address range: 300 to 918
Bryan Ave
Length: 0.49 miles
Direction: SE-NW
Address range: 300 to 799
Direction: SE-NW
Address range: 300 to 799
NE Bond St
Length: 0.44 miles
Direction: SW-NE
Address range: 700 to 1216
Direction: SW-NE
Address range: 700 to 1216
NE Commercial St
Length: 0.31 miles
Direction: SW-NE
Address range: 501 to 799
Direction: SW-NE
Address range: 501 to 799
Washington St
Length: 0.16 miles
Directions: E-W, SW-NE
Address range: 600 to 743
Directions: E-W, SW-NE
Address range: 600 to 743
NE Washington St
Length: 0.11 miles
Directions: E-W, N-S, SW-NE
Address range: 500 to 699
Directions: E-W, N-S, SW-NE
Address range: 500 to 699
Irving St
Length: 0.10 miles
Directions: N-S, SW-NE
Address range: 100 to 199
Directions: N-S, SW-NE
Address range: 100 to 199
Eaton St
Length: 0.08 miles
Directions: N-S, SW-NE
Address range: 222 to 299
Directions: N-S, SW-NE
Address range: 222 to 299
Fowler St
Length: 0.08 miles
Direction: SE-NW
Address range: 100 to 199
Direction: SE-NW
Address range: 100 to 199
Cross St
Length: 0.07 miles
Direction: SE-NW
Address range: 100 to 199
Direction: SE-NW
Address range: 100 to 199
Railroad features:
Chicago Rock Island and Pacific RR
Length: 0.44 miles
Direction: SW-NE
Direction: SW-NE