Old Town (Olde Town) neighborhood in Maywood, Illinois (IL), 60153, 60305 detailed profile
Settings
X


Business Search - 14 Million verified businesses
Area: 0.477 square miles
Population: 2,546
Population density:
| Old Town (Olde Town): | 5,338 people per square mile |
| Maywood: | 8,636 people per square mile |

- 1,49850.7%Black
- 59920.3%White
- 53418.1%Hispanic or Latino
- 2046.9%Two or more races
- 702.4%Asian
- 301.0%American Indian
- 220.7%Some other race

Median household income in 2022:
| Old Town (Olde Town): | $94,719 |
| Maywood: | $64,767 |
Distribution of median household income
![Distribution of median household income]()
- 165Less than $10,000
- 119$10,000 to $19,999
- 218$20,000 to $29,999
- 117$30,000 to $39,999
- 178$40,000 to $49,999
- 85$50,000 to $59,999
- 155$60,000 to $74,999
- 138$75,000 to $99,999
- 61$100,000 to $124,999
- 190$125,000 to $149,999
- 98$150,000 to $199,999
- 146$200,000 or more

Distribution of owner-occupied house/condo value
![Distribution of owner-occupied house/condo value]()
- 46Less than $50,000
- 60$50,000 to $99,999
- 255$100,000 to $149,999
- 183$150,000 to $199,999
- 97$200,000 to $249,999
- 44$250,000 to $299,999
- 116$300,000 to $399,999
- 257$400,000 to $499,999
- 174$500,000 to $749,999
- 115$750,000 to $999,999
- 172$1,000,000 or more

Distribution of rent paid by renters
![Distribution of rent paid by renters]()
- 73$100 to $199
- 231$200 to $299
- 175$300 to $399
- 171$400 to $499
- 62$500 to $599
- 97$600 to $699
- 147$700 to $799
- 108$800 to $899
- 60$900 to $999
- 147$1,000 to $1,249
- 139$1,250 to $1,499
- 103$1,500 to $1,999
- 86$2,000 or more

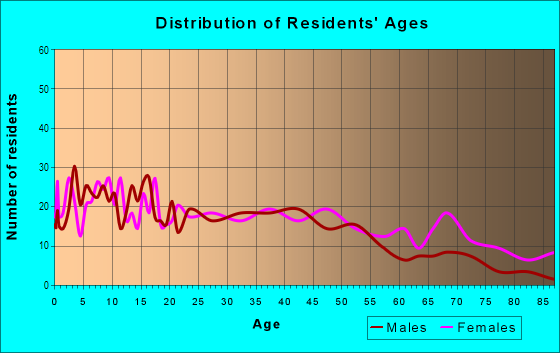
| Males: | 1,337 |
| Females: | 1,208 |
Males:
| This neighborhood: | 34.9 years |
| Whole city: | 34.8 years |
| This neighborhood: | 39.8 years |
| Whole city: | 40.6 years |
Average household size:
| Old Town (Olde Town): | 2.8 people |
| Maywood: | 33.0 people |
Percentage of family households:
| Old Town (Olde Town): | 39.1% |
| Maywood: | 47.2% |
| Here: | 32.6% |
| Maywood: | 36.1% |
Percentage of married-couple families with children (among all households):
| Old Town (Olde Town): | 19.5% |
| Maywood: | 15.9% |
Percentage of single-mother households (among all households):
| Old Town (Olde Town): | 33.8% |
| Maywood: | 13.6% |
Percentage of never married males 15 years old and over:
Percentage of never married females 15 years old and over:
| Old Town (Olde Town): | 18.3% |
| Maywood: | 22.4% |
Percentage of never married females 15 years old and over:
| Old Town (Olde Town): | 14.0% |
| village: | 22.9% |
Percentage of people that speak English not well or not at all:
| Old Town (Olde Town): | 13.1% |
| Maywood: | 6.1% |
Percentage of people born in this state:
Percentage of people born in another U.S. state:
Percentage of native residents but born outside the U.S.:
Percentage of foreign born residents:
| Here: | 62.4% |
| Maywood: | 69.5% |
Percentage of people born in another U.S. state:
| Old Town (Olde Town): | 18.9% |
| Maywood: | 14.9% |
Percentage of native residents but born outside the U.S.:
| Here: | 2.0% |
| village: | 2.4% |
Percentage of foreign born residents:
| Here: | 16.7% |
| Maywood: | 13.2% |

Owner-occupied
Renter-occupied


- Rooms in owner-occupied houses and condos in Old Town <
> - 501 room
- 222 rooms
- 313 rooms
- 474 rooms
- 1115 rooms
- 1826 rooms
- 1087 rooms
- 1048 rooms
- 1389+ rooms

- Rooms in renter-occupied apartments in Old Town <
> - 281 room
- 1052 rooms
- 2133 rooms
- 2364 rooms
- 705 rooms
- 1426 rooms
- 917 rooms
- 968 rooms
- 1099+ rooms
Owner-occupied
Renter-occupied

- Bedrooms in owner-occupied houses and condos in Old Town <
> - 50no bedroom
- 921 bedroom
- 912 bedrooms
- 2593 bedrooms
- 1564 bedrooms
- 685+ bedrooms

- Bedrooms in renter-occupied apartments in Old Town <
> - 42no bedroom
- 4581 bedroom
- 2392 bedrooms
- 1783 bedrooms
- 1024 bedrooms
- 465+ bedrooms
Average number of cars or other vehicles available in houses/condos:
Average number of cars or other vehicles available in apartments:
| This neighborhood: | 2.1 |
| Maywood: | 2.1 |
Average number of cars or other vehicles available in apartments:
| Here: | |
| village: |
Percentage of units with a mortgage:
| Old Town (Olde Town): | 69.8% |
| Maywood: | 66.9% |
Housing prices:
- Average estimated value of detached houses in 2022 (44.0% of all units):
Old Town (Olde Town): $180,905 Illinois: $310,164
- Average estimated value of townhouses or other attached units in 2022 (7.5% of all units):
This neighborhood: $235,040 Illinois: $286,230
- Average estimated value of housing units in 2-unit structures in 2022 (12.4% of all units):
This neighborhood: $180,297 Illinois: $299,638

- Year house built in Old Town <
> - 02020 or later
- 432010 to 2019
- 482000 to 2009
- 301990 to 1999
- 1141980 to 1989
- 2081970 to 1979
- 931960 to 1969
- 1831950 to 1959
- 431940 to 1949
- 6441939 or earlier

City-data.com crime index for village in 2020 (higher means more crime):
| City: | 501.0 |
| U.S. average: | 219.5 |
Travel time to work (commute)
![Travel time to work (commute)]()
- 40Less than 5 minutes
- 365 to 9 minutes
- 10510 to 14 minutes
- 7515 to 19 minutes
- 9920 to 24 minutes
- 4125 to 29 minutes
- 19030 to 34 minutes
- 5935 to 39 minutes
- 7540 to 44 minutes
- 11145 to 59 minutes
- 5060 to 89 minutes
- 4290 or more minutes

Means of transportation to work
![Means of transportation to work]()
- 68.0%627Drove a car alone
- 14.9%137Carpooled
- 18.7%172Bus
- 4.9%45Subway or elevated rail
- 6.9%64Long-distance train or commuter rail
- 2.8%26Light rail, streetcar or trolley
- 7.6%70Bicycle
- 6.2%57Walked
- 1.6%15Other means
- 10.7%99Worked at home

Time leaving home to go to work
![Time leaving home to go to work]()
- 2512:00 a.m. to 4:59 a.m.
- 495:00 a.m. to 5:29 a.m.
- 475:30 a.m. to 5:59 a.m.
- 816:00 a.m. to 6:29 a.m.
- 656:30 a.m. to 6:59 a.m.
- 2157:00 a.m. to 7:29 a.m.
- 847:30 a.m. to 7:59 a.m.
- 898:00 a.m. to 8:29 a.m.
- 508:30 a.m. to 8:59 a.m.
- 399:00 a.m. to 9:59 a.m.
- 2210:00 a.m. to 10:59 a.m.
- 311:00 a.m. to 11:59 a.m.
- 5612:00 p.m. to 3:59 p.m.
- 1074:00 p.m. to 11:59 p.m.

Occupations of males:
- Percentage of males in management occupations (except farmers):
Here: 5.0% village: 4.7%
- Percentage of males in business and financial operations occupations:
Here: 2.5% village: 1.9%
- Percentage of males in computer and mathematical occupations:
Here: 4.2% village: 2.8%
- Percentage of males in architecture and engineering occupations:
Here: 1.4% village: 3.2%
- Percentage of males in community and social services occupations:
Here: 2.9% village: 2.6%
- Percentage of males in legal occupations:
Here: 5.6% village: 0.0%
- Percentage of males in education, training, and library occupations:
Here: 1.1% village: 1.2%
- Percentage of males in healthcare practitioners and technical occupations:
Here: 6.4% village: 1.3%
- Percentage of males in service occupations:
Here: 5.9% village: 16.7%
- Percentage of males in sales and office occupations:
Here: 13.7% village: 14.7%
- Percentage of males in construction, extraction, and maintenance occupations:
Here: 15.7% village: 11.3%
- Percentage of males in production occupations:
Here: 21.7% village: 16.3%
- Percentage of males in material moving occupations:
Here: 8.3% village: 9.1%
Occupations of females:
- Percentage of females in management occupations (except farmers):
Here: 6.8% village: 3.1%
- Percentage of females in business and financial operations occupations:
Here: 16.3% village: 8.2%
- Percentage of females in architecture and engineering occupations:
Here: 2.5% village: 0.8%
- Percentage of females in community and social services occupations:
Here: 4.0% village: 4.3%
- Percentage of females in education, training, and library occupations:
Here: 12.8% village: 3.9%
- Percentage of females in arts, design, entertainment, sports, and media occupations:
Here: 2.1% village: 0.5%
- Percentage of females in healthcare practitioners and technical occupations:
Here: 6.3% village: 6.3%
- Percentage of females in service occupations:
Here: 21.7% village: 19.9%
- Percentage of females in sales and office occupations:
Here: 16.9% village: 35.6%
- Percentage of females in production occupations:
Here: 2.3% village: 9.2%
- Percentage of females in transportation occupations:
Here: 2.4% village: 2.6%
- Percentage of females in material moving occupations:
Here: 4.6% village: 2.9%
Percentage of people 16-64 in Armed Forces:
| Old Town (Olde Town): | 0.8% |
| Maywood: | 0.1% |
Education in this neighborhood (subdivision or community):
- Percentage of people 3 years and older in K-12 schools:
Old Town (Olde Town): 32.0% Maywood: 18.4%
- Percentage of people 3 years and older in undergraduate colleges:
Old Town (Olde Town): 5.1% Maywood: 6.6%
- Percentage of people 3 years and older in grad. or professional schools:
Old Town (Olde Town): 4.1% Maywood: 0.9%
- Percentage of students K-12 enrolled in private schools:
Old Town (Olde Town): 66.2% Maywood: 8.9%
Percentage of population below poverty level:
| Old Town (Olde Town): | 15.7% |
| Maywood: | 15.2% |
Percentage of married-couple families with both working:
| Old Town (Olde Town): | 123.4% |
| Maywood: | 73.0% |

- 73.4%Utility gas
- 14.3%Electricity
- 5.8%Other fuel
- 3.1%Fuel oil, kerosene, etc.
- 2.2%Bottled, tank, or LP gas
- 1.3%No fuel used
Highways in this neighborhood:
State Rte 171 (S 1st Ave)
Length: 0.50 miles
Directions: N-S, SW-NE
Address range: 200 to 999
Directions: N-S, SW-NE
Address range: 200 to 999
Roads and streets:
Washington Blvd
Length: 1.24 miles
Direction: E-W
Address range: 100 to 899
Direction: E-W
Address range: 100 to 899
Madison St
Length: 1.14 miles
Direction: E-W
Address range: 1 to 8098
Direction: E-W
Address range: 1 to 8098
Randolph St
Length: 0.68 miles
Direction: E-W
Address range: 100 to 899
Direction: E-W
Address range: 100 to 899
Oak St
Length: 0.68 miles
Direction: E-W
Address range: 100 to 899
Direction: E-W
Address range: 100 to 899
Pine St
Length: 0.68 miles
Direction: E-W
Address range: 100 to 899
Direction: E-W
Address range: 100 to 899
Maple St
Length: 0.68 miles
Direction: E-W
Address range: 100 to 899
Direction: E-W
Address range: 100 to 899
School St
Length: 0.63 miles
Direction: E-W
Address range: 100 to 849
Direction: E-W
Address range: 100 to 849
Warren Ave
Length: 0.63 miles
Direction: E-W
Address range: 100 to 849
Direction: E-W
Address range: 100 to 849
Walnut St
Length: 0.54 miles
Direction: E-W
Address range: 100 to 799
Direction: E-W
Address range: 100 to 799
S 7th Ave
Length: 0.50 miles
Direction: N-S
Address range: 200 to 999
Direction: N-S
Address range: 200 to 999
S 8th Ave
Length: 0.50 miles
Direction: N-S
Address range: 200 to 999
Direction: N-S
Address range: 200 to 999
S 4th Ave
Length: 0.50 miles
Direction: N-S
Address range: 200 to 999
Direction: N-S
Address range: 200 to 999
S 3rd Ave
Length: 0.50 miles
Direction: N-S
Address range: 200 to 999
Direction: N-S
Address range: 200 to 999
S 6th Ave
Length: 0.50 miles
Direction: N-S
Address range: 200 to 999
Direction: N-S
Address range: 200 to 999
S 5th Ave
Length: 0.50 miles
Direction: N-S
Address range: 200 to 999
Direction: N-S
Address range: 200 to 999
S 2nd Ave
Length: 0.47 miles
Direction: N-S
Address range: 200 to 999
Direction: N-S
Address range: 200 to 999
Thatcher Ave
Length: 0.37 miles
Direction: N-S
Address range: 1 to 299
Direction: N-S
Address range: 1 to 299
S 9th Ave
Length: 0.25 miles
Direction: N-S
Address range: 201 to 599
Direction: N-S
Address range: 201 to 599
Other features:
Des Plaines Riv
Length: 0.57 miles
Directions: N-S, SE-NW, SW-NE
Directions: N-S, SE-NW, SW-NE