Oakland Estates neighborhood in Millville, New Jersey (NJ), 08332 detailed profile
Settings
X


Business Search - 14 Million verified businesses
Area: 0.127 square miles
Population: 283
Population density:
| Oakland Estates: | 2,227 people per square mile |
| Millville: | 650 people per square mile |

- 14150.4%White
- 7426.4%Two or more races
- 3412.1%Black
- 3111.1%Hispanic or Latino

Median household income in 2022:
| Oakland Estates: | $66,375 |
| Millville: | $65,279 |
Distribution of median household income
![Distribution of median household income]()
- 11Less than $10,000
- 8$10,000 to $19,999
- 23$20,000 to $29,999
- 9$30,000 to $39,999
- 11$40,000 to $49,999
- 83$50,000 to $59,999
- 3$60,000 to $74,999
- 29$75,000 to $99,999
- 22$100,000 to $124,999
- 8$125,000 to $149,999
- 4$150,000 to $199,999
- 69$200,000 or more

Distribution of owner-occupied house/condo value
![Distribution of owner-occupied house/condo value]()
- 112Less than $50,000
- 79$50,000 to $99,999
- 7$100,000 to $149,999
- 25$150,000 to $199,999
- 4$200,000 to $249,999
- 4$300,000 to $399,999
- 27$400,000 to $499,999

Distribution of rent paid by renters
![Distribution of rent paid by renters]()
- 7$100 to $199
- 20$200 to $299
- 4$600 to $699
- 113$700 to $799
- 119$800 to $899
- 12$900 to $999
- 16$1,000 to $1,249
- 8$1,250 to $1,499

Median rent in 2022:
| Oakland Estates: | $919 |
| Millville: | $920 |
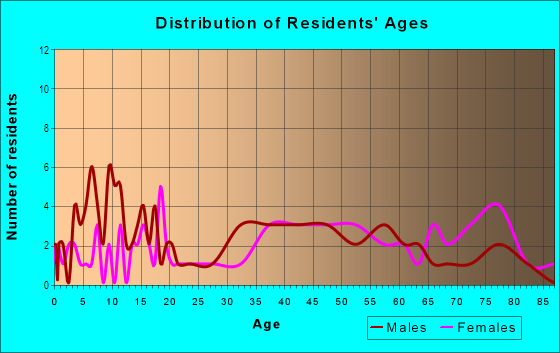
| Males: | 164 |
| Females: | 119 |
Males:
| This neighborhood: | 31.6 years |
| Whole city: | 39.6 years |
| This neighborhood: | 33.8 years |
| Whole city: | 46.0 years |
Average household size:
| Oakland Estates: | 2.3 people |
| Millville: | 2.3 people |
Percentage of family households:
| Oakland Estates: | 45.5% |
| Millville: | 42.1% |
| Here: | 29.5% |
| Millville: | 40.7% |
Percentage of married-couple families with children (among all households):
| Oakland Estates: | 43.5% |
| Millville: | 24.7% |
Percentage of single-mother households (among all households):
| Oakland Estates: | 333.1% |
| Millville: | 15.1% |
Percentage of never married males 15 years old and over:
Percentage of never married females 15 years old and over:
| Oakland Estates: | 36.5% |
| Millville: | 19.4% |
Percentage of never married females 15 years old and over:
| Oakland Estates: | 13.2% |
| city: | 15.1% |
Percentage of people born in this state:
Percentage of people born in another U.S. state:
Percentage of native residents but born outside the U.S.:
Percentage of foreign born residents:
| Here: | 74.1% |
| Millville: | 74.5% |
Percentage of people born in another U.S. state:
| Oakland Estates: | 12.7% |
| Millville: | 15.4% |
Percentage of native residents but born outside the U.S.:
| Here: | 2.5% |
| city: | 3.2% |
Percentage of foreign born residents:
| Here: | 10.7% |
| Millville: | 7.0% |

Owner-occupied
Renter-occupied


- Rooms in owner-occupied houses and condos in Oakland Estates
- 01 room
- 02 rooms
- 03 rooms
- 1354 rooms
- 35 rooms
- 206 rooms
- 157 rooms
- 158 rooms
- 39+ rooms

- Rooms in renter-occupied apartments in Oakland Estates
- 151 room
- 52 rooms
- 143 rooms
- 204 rooms
- 5005 rooms
- 76 rooms
- 2067 rooms
- 458 rooms
- 09+ rooms
Owner-occupied
Renter-occupied

- Bedrooms in owner-occupied houses and condos in Oakland Estates
- 0no bedroom
- 01 bedroom
- 132 bedrooms
- 413 bedrooms
- 34 bedrooms
- 05+ bedrooms

- Bedrooms in renter-occupied apartments in Oakland Estates
- 15no bedroom
- 201 bedroom
- 282 bedrooms
- 1413 bedrooms
- 754 bedrooms
- 05+ bedrooms
Average number of cars or other vehicles available in houses/condos:
Average number of cars or other vehicles available in apartments:
| This neighborhood: | 22.4 |
| Millville: | 2.0 |
Average number of cars or other vehicles available in apartments:
| Here: | 15.9 |
| city: | 0.9 |
Percentage of units with a mortgage:
| Oakland Estates: | 60.0% |
| Millville: | 62.3% |
Housing prices:
- Average estimated value of detached houses in 2022 (30.2% of all units):
Oakland Estates: $128,519 New Jersey: $537,591
- Average estimated value of townhouses or other attached units in 2022 (34.6% of all units):
This neighborhood: $99,270 New Jersey: $381,113

- Year house built in Oakland Estates
- 02020 or later
- 02010 to 2019
- 72000 to 2009
- 291990 to 1999
- 111980 to 1989
- 121970 to 1979
- 301960 to 1969
- 31950 to 1959
- 41940 to 1949
- 1011939 or earlier

City-data.com crime index for city in 2020 (higher means more crime):
| City: | 326.3 |
| U.S. average: | 219.5 |
Travel time to work (commute)
![Travel time to work (commute)]()
- 42Less than 5 minutes
- 4605 to 9 minutes
- 50010 to 14 minutes
- 23115 to 19 minutes
- 23420 to 24 minutes
- 10425 to 29 minutes
- 15130 to 34 minutes
- 14940 to 44 minutes
- 845 to 59 minutes
- 10660 to 89 minutes
- 3290 or more minutes

Means of transportation to work
![Means of transportation to work]()
- 63.1%89Drove a car alone
- 11.3%16Carpooled
- 5.0%7Ferryboat
- 9.2%13Bicycle
- 6.4%9Walked
- 2.1%3Other means
- 77.9%110Worked at home

Time leaving home to go to work
![Time leaving home to go to work]()
- 5912:00 a.m. to 4:59 a.m.
- 1115:00 a.m. to 5:29 a.m.
- 375:30 a.m. to 5:59 a.m.
- 2366:00 a.m. to 6:29 a.m.
- 1226:30 a.m. to 6:59 a.m.
- 527:00 a.m. to 7:29 a.m.
- 2597:30 a.m. to 7:59 a.m.
- 1858:00 a.m. to 8:29 a.m.
- 3668:30 a.m. to 8:59 a.m.
- 1499:00 a.m. to 9:59 a.m.
- 5410:00 a.m. to 10:59 a.m.
- 44512:00 p.m. to 3:59 p.m.
- 364:00 p.m. to 11:59 p.m.

Occupations of males:
- Percentage of males in computer and mathematical occupations:
Here: 68.8% city: 3.2%
- Percentage of males in architecture and engineering occupations:
Here: 24.8% city: 2.7%
- Percentage of males in community and social services occupations:
Here: 60.5% city: 2.4%
- Percentage of males in education, training, and library occupations:
Here: 2.8% city: 2.6%
- Percentage of males in arts, design, entertainment, sports, and media occupations:
Here: 79.8% city: 1.9%
- Percentage of males in service occupations:
Here: 49.5% city: 23.8%
- Percentage of males in sales and office occupations:
Here: 12.9% city: 8.0%
- Percentage of males in farming, fishing, and forestry occupations:
Here: 104.6% city: 0.6%
- Percentage of males in construction, extraction, and maintenance occupations:
Here: 15.9% city: 14.1%
- Percentage of males in production occupations:
Here: 289.0% city: 9.0%
- Percentage of males in transportation occupations:
Here: 9.4% city: 6.5%
- Percentage of males in material moving occupations:
Here: 12.3% city: 10.7%
Occupations of females:
- Percentage of females in management occupations (except farmers):
Here: 11.5% city: 6.5%
- Percentage of females in education, training, and library occupations:
Here: 202.7% city: 5.2%
- Percentage of females in healthcare practitioners and technical occupations:
Here: 9.8% city: 12.8%
- Percentage of females in service occupations:
Here: 17.4% city: 31.2%
- Percentage of females in sales and office occupations:
Here: 53.2% city: 24.0%
- Percentage of females in production occupations:
Here: 47.0% city: 6.8%
- Percentage of females in transportation occupations:
Here: 8.1% city: 2.6%
Education in this neighborhood (subdivision or community):
- Percentage of people 3 years and older in K-12 schools:
Oakland Estates: 100.0% Millville: 16.0%
- Percentage of people 3 years and older in undergraduate colleges:
Oakland Estates: 4.5% Millville: 3.5%
- Percentage of people 3 years and older in grad. or professional schools:
Oakland Estates: 1.1% Millville: 0.7%
- Percentage of students K-12 enrolled in private schools:
Oakland Estates: 21.8% Millville: 2.1%
Percentage of population below poverty level:
| Oakland Estates: | 7.4% |
| Millville: | 11.4% |
Median year owner moved in (as recorded in 2022):
Median year renter moved in (as recorded in 2022):
| Oakland Estates: | 2003 |
| Millville: | 2002 |
Median year renter moved in (as recorded in 2022):
| Oakland Estates: | 2019 |
| Millville: | 2016 |
Percentage of married-couple families with both working:
| Oakland Estates: | 86.5% |
| Millville: | 80.1% |

- 55.8%Utility gas
- 28.2%Fuel oil, kerosene, etc.
- 12.4%Electricity
- 3.6%Wood
Roads and streets:
Sharp St
Length: 0.68 miles
Direction: SW-NE
Address range: 68 to 499
Direction: SW-NE
Address range: 68 to 499
Sunset Dr
Length: 0.59 miles
Directions: N-S, SE-NW, SW-NE
Address range: 1 to 1499
Directions: N-S, SE-NW, SW-NE
Address range: 1 to 1499
Oak Dale Dr
Length: 0.53 miles
Directions: E-W, SW-NE
Address range: 1 to 99
Directions: E-W, SW-NE
Address range: 1 to 99
Homestead Dr
Length: 0.39 miles
Directions: E-W, SW-NE
Address range: 16 to 99
Directions: E-W, SW-NE
Address range: 16 to 99
Union Lake Rd
Length: 0.27 miles
Direction: E-W
Address range: 300 to 499
Direction: E-W
Address range: 300 to 499
Glenside Rd
Length: 0.25 miles
Direction: E-W
Address range: 300 to 599
Direction: E-W
Address range: 300 to 599
Fernwood Dr (Fernwood Rd)
Length: 0.17 miles
Direction: E-W
Address range: 300 to 499
Direction: E-W
Address range: 300 to 499
W Harrison Ave
Length: 0.17 miles
Direction: E-W
Address range: 300 to 499
Direction: E-W
Address range: 300 to 499
Ferguson Ct
Length: 0.15 miles
Directions: N-S, SW-NE
Address range: 1 to 99
Directions: N-S, SW-NE
Address range: 1 to 99
Hayes Ave
Length: 0.13 miles
Direction: N-S
Address range: 1 to 99
Direction: N-S
Address range: 1 to 99
Fernwood Ave
Length: 0.07 miles
Directions: N-S, SE-NW
Directions: N-S, SE-NW
Columbia Ave
Length: 0.01 miles
Direction: SE-NW
Address range: 1000 to 1099
Direction: SE-NW
Address range: 1000 to 1099