Oakcliff neighborhood in Peoria, Illinois (IL), 61614 detailed profile
Settings
X


Business Search - 14 Million verified businesses
Area: 0.102 square miles
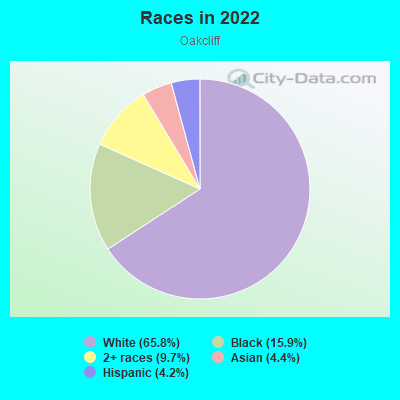
Population: 385
Population density:
| Oakcliff: | 3,758 people per square mile |
| Peoria: | 2,460 people per square mile |

- 25265.8%White
- 6115.9%Black
- 379.7%Two or more races
- 174.4%Asian
- 164.2%Hispanic or Latino
Median household income in 2022:
| Oakcliff: | $49,051 |
| Peoria: | $55,955 |
Distribution of median household income
![Distribution of median household income]()
- 26Less than $10,000
- 20$10,000 to $19,999
- 9$20,000 to $29,999
- 13$30,000 to $39,999
- 38$40,000 to $49,999
- 7$50,000 to $59,999
- 17$60,000 to $74,999
- 20$75,000 to $99,999
- 19$100,000 to $124,999
- 6$125,000 to $149,999
- 10$150,000 to $199,999
- 7$200,000 or more

Distribution of owner-occupied house/condo value
![Distribution of owner-occupied house/condo value]()
- 3Less than $50,000
- 40$50,000 to $99,999
- 22$100,000 to $149,999
- 21$150,000 to $199,999
- 4$200,000 to $249,999
- 3$250,000 to $299,999
- 3$300,000 to $399,999
- 5$750,000 to $999,999

Distribution of rent paid by renters
![Distribution of rent paid by renters]()
- 5Less than $100
- 6$100 to $199
- 2$200 to $299
- 4$300 to $399
- 2$400 to $499
- 11$500 to $599
- 46$600 to $699
- 27$700 to $799
- 3$800 to $899
- 8$900 to $999
- 2$1,000 to $1,249
- 2$1,250 to $1,499
- 4$1,500 to $1,999

Median rent in 2022:
| Oakcliff: | $661 |
| Peoria: | $696 |
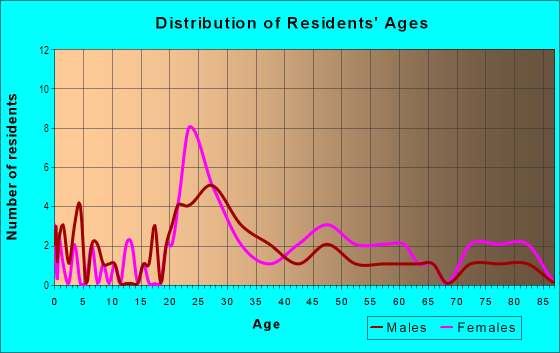
| Males: | 192 |
| Females: | 192 |
Males:
| This neighborhood: | 37.1 years |
| Whole city: | 33.8 years |
| This neighborhood: | 28.3 years |
| Whole city: | 36.0 years |
Average household size:
| Oakcliff: | 2.2 people |
| Peoria: | 2.2 people |
Percentage of family households:
| Oakcliff: | 32.9% |
| Peoria: | 41.0% |
| Here: | 26.3% |
| Peoria: | 33.8% |
Percentage of married-couple families with children (among all households):
| Oakcliff: | 24.9% |
| Peoria: | 22.1% |
Percentage of single-mother households (among all households):
| Oakcliff: | 20.1% |
| Peoria: | 16.8% |
Percentage of never married males 15 years old and over:
Percentage of never married females 15 years old and over:
| Oakcliff: | 20.7% |
| Peoria: | 19.6% |
Percentage of never married females 15 years old and over:
| Oakcliff: | 27.2% |
| city: | 19.0% |
Percentage of people that speak English not well or not at all:
| Oakcliff: | 0.0% |
| Peoria: | 1.6% |
Percentage of people born in this state:
Percentage of people born in another U.S. state:
Percentage of native residents but born outside the U.S.:
Percentage of foreign born residents:
| Here: | 72.6% |
| Peoria: | 72.0% |
Percentage of people born in another U.S. state:
| Oakcliff: | 24.7% |
| Peoria: | 18.8% |
Percentage of native residents but born outside the U.S.:
| Here: | 0.5% |
| city: | 1.4% |
Percentage of foreign born residents:
| Here: | 2.3% |
| Peoria: | 7.8% |
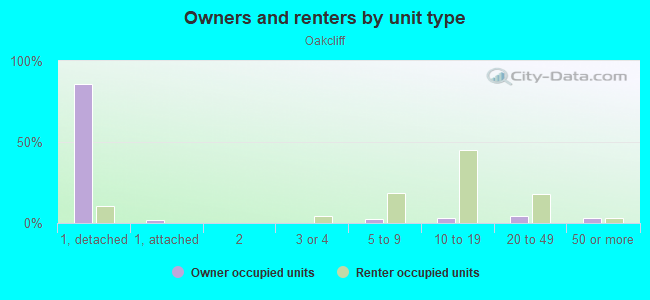
Owner-occupied
Renter-occupied

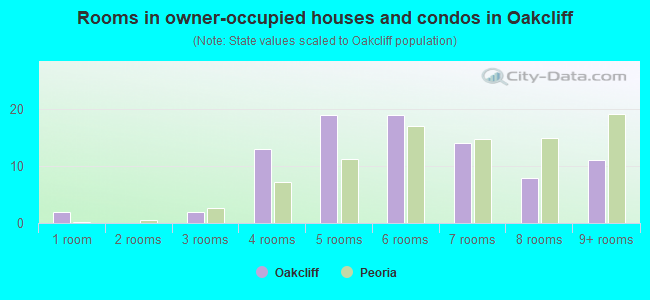
- Rooms in owner-occupied houses and condos in Oakcliff
- 21 room
- 02 rooms
- 23 rooms
- 134 rooms
- 195 rooms
- 196 rooms
- 147 rooms
- 88 rooms
- 119+ rooms
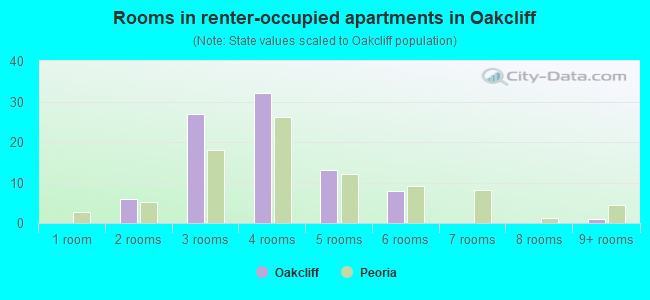
- Rooms in renter-occupied apartments in Oakcliff
- 01 room
- 62 rooms
- 273 rooms
- 324 rooms
- 135 rooms
- 86 rooms
- 07 rooms
- 08 rooms
- 19+ rooms
Owner-occupied
Renter-occupied
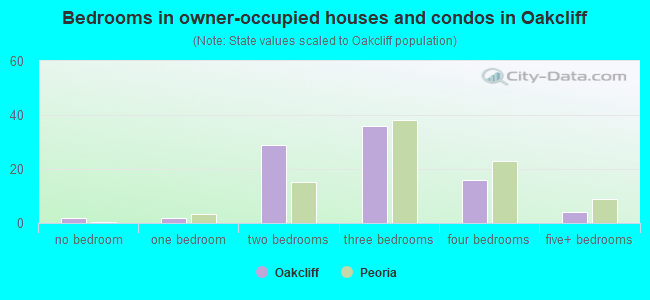
- Bedrooms in owner-occupied houses and condos in Oakcliff
- 2no bedroom
- 21 bedroom
- 292 bedrooms
- 363 bedrooms
- 164 bedrooms
- 45+ bedrooms
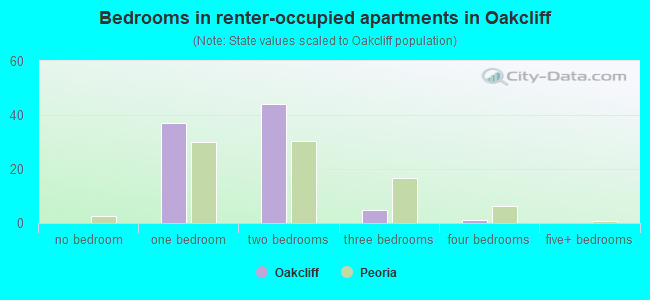
- Bedrooms in renter-occupied apartments in Oakcliff
- 0no bedroom
- 371 bedroom
- 442 bedrooms
- 53 bedrooms
- 14 bedrooms
- 05+ bedrooms
Average number of cars or other vehicles available in houses/condos:
Average number of cars or other vehicles available in apartments:
| This neighborhood: | 1.9 |
| Peoria: | 1.8 |
Average number of cars or other vehicles available in apartments:
| Here: | 0.9 |
| city: | 1.1 |
Percentage of units with a mortgage:
| Oakcliff: | 77.1% |
| Peoria: | 63.0% |
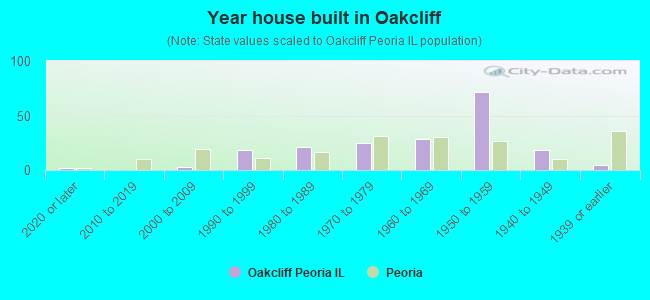
- Year house built in Oakcliff
- 22020 or later
- 02010 to 2019
- 32000 to 2009
- 181990 to 1999
- 211980 to 1989
- 251970 to 1979
- 281960 to 1969
- 721950 to 1959
- 181940 to 1949
- 51939 or earlier
City-data.com crime index for city in 2020 (higher means more crime):
| City: | 443.5 |
| U.S. average: | 219.5 |
Travel time to work (commute)
![Travel time to work (commute)]()
- 13Less than 5 minutes
- 235 to 9 minutes
- 4910 to 14 minutes
- 3415 to 19 minutes
- 2020 to 24 minutes
- 325 to 29 minutes
- 530 to 34 minutes
- 335 to 39 minutes
- 240 to 44 minutes
- 560 to 89 minutes

Means of transportation to work
![Means of transportation to work]()
- 83.9%165Drove a car alone
- 4.6%9Carpooled
- 3.1%6Bus
- 1.5%3Bicycle
- 6.6%13Walked
- 1.0%2Worked at home

Time leaving home to go to work
![Time leaving home to go to work]()
- 112:00 a.m. to 4:59 a.m.
- 25:00 a.m. to 5:29 a.m.
- 105:30 a.m. to 5:59 a.m.
- 146:00 a.m. to 6:29 a.m.
- 186:30 a.m. to 6:59 a.m.
- 147:00 a.m. to 7:29 a.m.
- 287:30 a.m. to 7:59 a.m.
- 218:00 a.m. to 8:29 a.m.
- 68:30 a.m. to 8:59 a.m.
- 49:00 a.m. to 9:59 a.m.
- 610:00 a.m. to 10:59 a.m.
- 611:00 a.m. to 11:59 a.m.
- 1312:00 p.m. to 3:59 p.m.
- 144:00 p.m. to 11:59 p.m.

Occupations of males:
- Percentage of males in management occupations (except farmers):
Here: 4.7% city: 11.1%
- Percentage of males in business and financial operations occupations:
Here: 2.0% city: 4.5%
- Percentage of males in architecture and engineering occupations:
Here: 5.0% city: 9.0%
- Percentage of males in life, physical, and social science occupations:
Here: 1.3% city: 1.0%
- Percentage of males in community and social services occupations:
Here: 1.1% city: 1.3%
- Percentage of males in legal occupations:
Here: 2.0% city: 1.2%
- Percentage of males in education, training, and library occupations:
Here: 6.5% city: 3.7%
- Percentage of males in healthcare practitioners and technical occupations:
Here: 5.5% city: 4.7%
- Percentage of males in service occupations:
Here: 18.4% city: 15.9%
- Percentage of males in sales and office occupations:
Here: 9.2% city: 12.1%
- Percentage of males in construction, extraction, and maintenance occupations:
Here: 5.2% city: 5.4%
- Percentage of males in production occupations:
Here: 17.2% city: 7.6%
- Percentage of males in transportation occupations:
Here: 1.7% city: 5.1%
- Percentage of males in material moving occupations:
Here: 11.2% city: 6.4%
Occupations of females:
- Percentage of females in management occupations (except farmers):
Here: 4.0% city: 8.2%
- Percentage of females in business and financial operations occupations:
Here: 1.8% city: 3.9%
- Percentage of females in life, physical, and social science occupations:
Here: 1.4% city: 1.4%
- Percentage of females in community and social services occupations:
Here: 3.0% city: 3.4%
- Percentage of females in legal occupations:
Here: 2.1% city: 1.0%
- Percentage of females in education, training, and library occupations:
Here: 15.6% city: 9.3%
- Percentage of females in healthcare practitioners and technical occupations:
Here: 16.5% city: 14.9%
- Percentage of females in service occupations:
Here: 33.0% city: 24.2%
- Percentage of females in sales and office occupations:
Here: 25.2% city: 23.2%
- Percentage of females in production occupations:
Here: 3.5% city: 2.4%
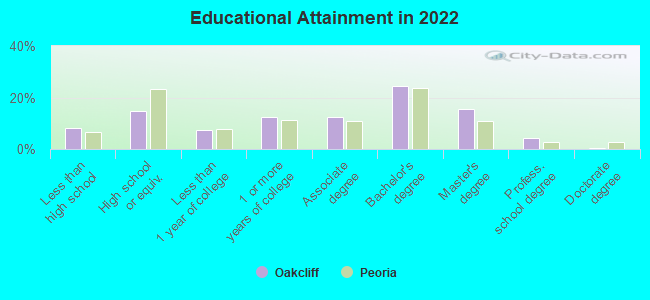
Education in this neighborhood (subdivision or community):
- Percentage of people 3 years and older in K-12 schools:
Oakcliff: 15.5% Peoria: 17.8%
- Percentage of people 3 years and older in undergraduate colleges:
Oakcliff: 9.4% Peoria: 7.5%
- Percentage of people 3 years and older in grad. or professional schools:
Oakcliff: 3.0% Peoria: 2.5%
- Percentage of students K-12 enrolled in private schools:
Oakcliff: 28.6% Peoria: 16.0%
Percentage of population below poverty level:
| Oakcliff: | 16.0% |
| Peoria: | 17.4% |
Median year owner moved in (as recorded in 2022):
Median year renter moved in (as recorded in 2022):
| Oakcliff: | 2011 |
| Peoria: | 2013 |
Median year renter moved in (as recorded in 2022):
| Oakcliff: | 2016 |
| Peoria: | 2020 |
Percentage of married-couple families with both working:
| Oakcliff: | 81.2% |
| Peoria: | 71.4% |
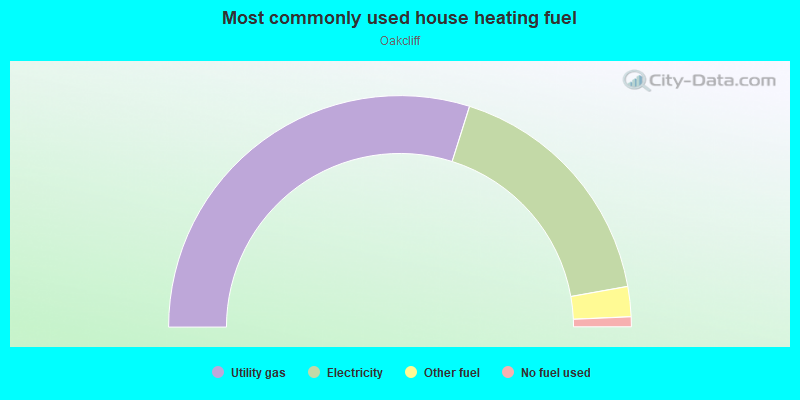
- 59.8%Utility gas
- 34.7%Electricity
- 4.2%Other fuel
- 1.4%No fuel used
Highways in this neighborhood:
N Knoxville Ave (State Rte 40, N State Rte 40, State Rte 88)
Length: 0.09 miles
Direction: N-S
Address range: 4500 to 4599
Direction: N-S
Address range: 4500 to 4599
Roads and streets:
E Oak Cliff Ct
Length: 0.36 miles
Directions: E-W, N-S, SE-NW, SW-NE
Address range: 100 to 299
Directions: E-W, N-S, SE-NW, SW-NE
Address range: 100 to 299