Newtonville Historic District neighborhood in West Newton, Massachusetts (MA), 02460, 02465 detailed profile
Settings
X


Area: 0.156 square miles
Population: 750
Population density: 4,816 people per square mile

- 48362.4%White
- 11715.1%Some other race
- 8811.4%Asian
- 415.3%Two or more races
- 253.2%American Indian
- 121.6%Black
- 81.0%Hispanic or Latino

Median household income in 2022:
| Newtonville Historic District: | $209,961 |
| Massachusetts: | $94,488 |
Distribution of median household income
![Distribution of median household income]()
- 12Less than $10,000
- 25$10,000 to $19,999
- 15$20,000 to $29,999
- 39$30,000 to $39,999
- 42$40,000 to $49,999
- 9$50,000 to $59,999
- 42$60,000 to $74,999
- 16$75,000 to $99,999
- 22$100,000 to $124,999
- 9$125,000 to $149,999
- 21$150,000 to $199,999
- 186$200,000 or more

Distribution of owner-occupied house/condo value
![Distribution of owner-occupied house/condo value]()
- 5$200,000 to $249,999
- 20$250,000 to $299,999
- 9$300,000 to $399,999
- 20$400,000 to $499,999
- 19$500,000 to $749,999
- 6$750,000 to $999,999
- 167$1,000,000 or more

Distribution of rent paid by renters
![Distribution of rent paid by renters]()
- 4Less than $100
- 21$200 to $299
- 19$300 to $399
- 5$600 to $699
- 3$700 to $799
- 2$900 to $999
- 5$1,000 to $1,249
- 12$1,250 to $1,499
- 37$1,500 to $1,999
- 102$2,000 or more

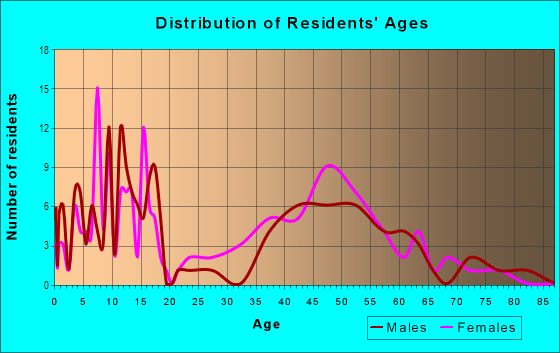
| Males: | 337 |
| Females: | 412 |
| Males: | 49.3 years |
| Females: | 45.6 years |
Average household size:
| Newtonville Historic District: | 2.7 people |
| Massachusetts: | 2.4 people |
Percentage of family households:
| Newtonville Historic District: | 64.7% |
| Massachusetts: | 43.1% |
| Here: | 72.4% |
| Massachusetts: | 45.2% |
Percentage of married-couple families with children (among all households):
| Newtonville Historic District: | 31.6% |
| Massachusetts: | 56.2% |
Percentage of single-mother households (among all households):
| Newtonville Historic District: | 2.5% |
| Massachusetts: | 8.7% |
Percentage of never married males 15 years old and over:
Percentage of never married females 15 years old and over:
| Newtonville Historic District: | 13.6% |
| Massachusetts: | 19.4% |
Percentage of never married females 15 years old and over:
| Newtonville Historic District: | 5.9% |
| Massachusetts: | 18.4% |
Percentage of people that speak English not well or not at all:
| Newtonville Historic District: | 1.9% |
| Massachusetts: | 5.2% |
Percentage of people born in this state:
Percentage of people born in another U.S. state:
Percentage of native residents but born outside the U.S.:
Percentage of foreign born residents:
| Here: | 35.8% |
| Massachusetts: | 58.6% |
Percentage of people born in another U.S. state:
| Newtonville Historic District: | 40.3% |
| Massachusetts: | 20.5% |
Percentage of native residents but born outside the U.S.:
| Here: | 1.4% |
| Massachusetts: | 2.8% |
Percentage of foreign born residents:
| Here: | 22.5% |
| Massachusetts: | 18.0% |

Owner-occupied
Renter-occupied


- Rooms in owner-occupied houses and condos in Newtonville Historic District
- 01 room
- 02 rooms
- 03 rooms
- 144 rooms
- 105 rooms
- 166 rooms
- 227 rooms
- 118 rooms
- 1359+ rooms

- Rooms in renter-occupied apartments in Newtonville Historic District
- 01 room
- 72 rooms
- 83 rooms
- 234 rooms
- 215 rooms
- 66 rooms
- 157 rooms
- 88 rooms
- 119+ rooms
Owner-occupied
Renter-occupied

- Bedrooms in owner-occupied houses and condos in Newtonville Historic District
- 0no bedroom
- 01 bedroom
- 292 bedrooms
- 593 bedrooms
- 434 bedrooms
- 925+ bedrooms

- Bedrooms in renter-occupied apartments in Newtonville Historic District
- 0no bedroom
- 221 bedroom
- 232 bedrooms
- 143 bedrooms
- 54 bedrooms
- 25+ bedrooms
Average number of cars or other vehicles available in houses/condos:
Average number of cars or other vehicles available in apartments:
| This neighborhood: | 2.1 |
| Massachusetts: | 2.0 |
Average number of cars or other vehicles available in apartments:
| Here: | 2.0 |
| Massachusetts: | 1.1 |
Percentage of units with a mortgage:
| Newtonville Historic District: | 77.3% |
| Massachusetts: | 65.5% |
Average estimated value of detached houses in 2022 (74.2% of all units):
| Newtonville Historic District: | $2,117,632 |
| Massachusetts: | $651,570 |

- Year house built in Newtonville Historic District
- 172020 or later
- 212010 to 2019
- 302000 to 2009
- 61990 to 1999
- 21980 to 1989
- 61970 to 1979
- 341960 to 1969
- 361950 to 1959
- 81940 to 1949
- 2091939 or earlier

Travel time to work (commute)
![Travel time to work (commute)]()
- 4Less than 5 minutes
- 155 to 9 minutes
- 2510 to 14 minutes
- 2715 to 19 minutes
- 5620 to 24 minutes
- 1825 to 29 minutes
- 6130 to 34 minutes
- 2835 to 39 minutes
- 2140 to 44 minutes
- 1845 to 59 minutes
- 360 to 89 minutes

Means of transportation to work
![Means of transportation to work]()
- 71.4%287Drove a car alone
- 9.7%39Carpooled
- 4.5%18Bus
- 1.2%5Subway or elevated rail
- 3.0%12Long-distance train or commuter rail
- 2.2%9Light rail, streetcar or trolley
- 2.0%8Bicycle
- 3.5%14Walked
- 4.2%17Other means
- 23.1%93Worked at home

Time leaving home to go to work
![Time leaving home to go to work]()
- 86:00 a.m. to 6:29 a.m.
- 216:30 a.m. to 6:59 a.m.
- 417:00 a.m. to 7:29 a.m.
- 327:30 a.m. to 7:59 a.m.
- 768:00 a.m. to 8:29 a.m.
- 448:30 a.m. to 8:59 a.m.
- 339:00 a.m. to 9:59 a.m.
- 1210:00 a.m. to 10:59 a.m.
- 511:00 a.m. to 11:59 a.m.
- 512:00 p.m. to 3:59 p.m.
- 244:00 p.m. to 11:59 p.m.

Occupations of males:
- Percentage of males in management occupations (except farmers):
Here: 23.5% Massachusetts: 14.0%
- Percentage of males in business and financial operations occupations:
Here: 2.0% Massachusetts: 6.5%
- Percentage of males in computer and mathematical occupations:
Here: 3.4% Massachusetts: 6.9%
- Percentage of males in life, physical, and social science occupations:
Here: 5.4% Massachusetts: 2.4%
- Percentage of males in legal occupations:
Here: 9.7% Massachusetts: 1.5%
- Percentage of males in education, training, and library occupations:
Here: 6.6% Massachusetts: 4.3%
- Percentage of males in healthcare practitioners and technical occupations:
Here: 17.8% Massachusetts: 3.2%
- Percentage of males in service occupations:
Here: 10.3% Massachusetts: 13.5%
- Percentage of males in sales and office occupations:
Here: 11.7% Massachusetts: 14.0%
- Percentage of males in production occupations:
Here: 9.2% Massachusetts: 5.1%
Occupations of females:
- Percentage of females in management occupations (except farmers):
Here: 20.5% Massachusetts: 11.3%
- Percentage of females in business and financial operations occupations:
Here: 3.6% Massachusetts: 7.6%
- Percentage of females in life, physical, and social science occupations:
Here: 7.2% Massachusetts: 2.4%
- Percentage of females in community and social services occupations:
Here: 9.3% Massachusetts: 3.1%
- Percentage of females in education, training, and library occupations:
Here: 22.4% Massachusetts: 10.9%
- Percentage of females in arts, design, entertainment, sports, and media occupations:
Here: 6.8% Massachusetts: 2.6%
- Percentage of females in healthcare practitioners and technical occupations:
Here: 16.3% Massachusetts: 10.8%
- Percentage of females in service occupations:
Here: 7.2% Massachusetts: 18.3%
- Percentage of females in sales and office occupations:
Here: 6.2% Massachusetts: 22.6%
Education in this neighborhood (subdivision or community):
- Percentage of people 3 years and older in K-12 schools:
Newtonville Historic District: 36.5% Massachusetts: 14.7%
- Percentage of people 3 years and older in undergraduate colleges:
Newtonville Historic District: 2.4% Massachusetts: 5.9%
- Percentage of people 3 years and older in grad. or professional schools:
Newtonville Historic District: 4.6% Massachusetts: 2.2%
- Percentage of students K-12 enrolled in private schools:
Newtonville Historic District: 20.4% Massachusetts: 11.0%
Percentage of population below poverty level:
| Newtonville Historic District: | 5.9% |
| Massachusetts: | 10.4% |
Median year owner moved in (as recorded in 2022):
| Newtonville Historic District: | 2001 |
| Massachusetts: | 2009 |
Percentage of married-couple families with both working:
| Newtonville Historic District: | 100.6% |
| Massachusetts: | 78.0% |

- 60.4%Utility gas
- 12.5%Electricity
- 10.9%Fuel oil, kerosene, etc.
- 9.8%Bottled, tank, or LP gas
- 3.7%Other fuel
- 2.6%No fuel used
Roads and streets:
Highland St
Length: 0.78 miles
Direction: E-W
Address range: 224 to 499
Direction: E-W
Address range: 224 to 499
Otis St
Length: 0.61 miles
Directions: E-W, SW-NE
Address range: 90 to 285
Directions: E-W, SW-NE
Address range: 90 to 285
Lowell Ave
Length: 0.28 miles
Direction: N-S
Address range: 262 to 385
Direction: N-S
Address range: 262 to 385
Forest Ave
Length: 0.27 miles
Directions: E-W, N-S, SE-NW
Address range: 30 to 159
Directions: E-W, N-S, SE-NW
Address range: 30 to 159
Greylock Rd
Length: 0.21 miles
Directions: E-W, N-S, SE-NW
Address range: 1 to 99
Directions: E-W, N-S, SE-NW
Address range: 1 to 99
Walden St
Length: 0.19 miles
Direction: N-S
Address range: 1 to 99
Direction: N-S
Address range: 1 to 99
Calvin Rd
Length: 0.15 miles
Direction: E-W
Address range: 1 to 99
Direction: E-W
Address range: 1 to 99
Somerset Rd
Length: 0.15 miles
Directions: N-S, SE-NW
Address range: 1 to 99
Directions: N-S, SE-NW
Address range: 1 to 99
Bolton Rd
Length: 0.14 miles
Direction: E-W
Address range: 1 to 99
Direction: E-W
Address range: 1 to 99
Regent St
Length: 0.14 miles
Direction: E-W
Address range: 1 to 99
Direction: E-W
Address range: 1 to 99
Lenox St
Length: 0.14 miles
Direction: N-S
Address range: 1 to 49
Direction: N-S
Address range: 1 to 49
Fairfield St
Length: 0.13 miles
Direction: N-S
Address range: 1 to 99
Direction: N-S
Address range: 1 to 99
Leonard Ave
Length: 0.11 miles
Direction: N-S
Address range: 1 to 99
Direction: N-S
Address range: 1 to 99
Balcarres Rd
Length: 0.08 miles
Directions: N-S, SE-NW
Address range: 1 to 99
Directions: N-S, SE-NW
Address range: 1 to 99
Fountain St
Length: 0.06 miles
Direction: N-S
Address range: 26 to 77
Direction: N-S
Address range: 26 to 77
Highland Ave
Length: 0.05 miles
Direction: E-W
Address range: 230 to 270
Direction: E-W
Address range: 230 to 270