Neighborhood S (S) neighborhood in Rohnert Park, California (CA), 94928 detailed profile
Settings
X


Business Search - 14 Million verified businesses
Area: 0.172 square miles
Population: 2,120
Population density:
| Neighborhood S (S): | 12,299 people per square mile |
| Rohnert Park: | 6,910 people per square mile |

- 1,10446.2%White
- 73030.5%Hispanic or Latino
- 1436.0%Asian
- 1215.1%American Indian
- 1084.5%Black
- 1034.3%Some other race
- 833.5%Two or more races

Median household income in 2022:
| Neighborhood S (S): | $104,322 |
| Rohnert Park: | $93,322 |
Distribution of median household income
![Distribution of median household income]()
- 14Less than $10,000
- 53$10,000 to $19,999
- 80$20,000 to $29,999
- 55$30,000 to $39,999
- 104$40,000 to $49,999
- 34$50,000 to $59,999
- 145$60,000 to $74,999
- 144$75,000 to $99,999
- 169$100,000 to $124,999
- 101$125,000 to $149,999
- 69$150,000 to $199,999
- 101$200,000 or more

Distribution of owner-occupied house/condo value
![Distribution of owner-occupied house/condo value]()
- 138Less than $50,000
- 227$50,000 to $99,999
- 70$100,000 to $149,999
- 141$150,000 to $199,999
- 180$200,000 to $249,999
- 36$250,000 to $299,999
- 92$300,000 to $399,999
- 197$400,000 to $499,999
- 139$500,000 to $749,999
- 87$750,000 to $999,999
- 41$1,000,000 or more

Distribution of rent paid by renters
![Distribution of rent paid by renters]()
- 1Less than $100
- 13$400 to $499
- 17$900 to $999
- 17$1,000 to $1,249
- 3$1,250 to $1,499
- 221$1,500 to $1,999
- 162$2,000 or more

Median rent in 2022:
| Neighborhood S (S): | $1,902 |
| Rohnert Park: | $1,984 |
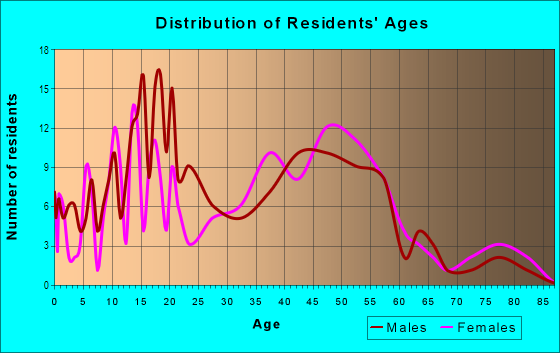
| Males: | 997 |
| Females: | 1,123 |
Males:
| This neighborhood: | 43.3 years |
| Whole city: | 35.9 years |
| This neighborhood: | 48.6 years |
| Whole city: | 34.5 years |
Average household size:
| Neighborhood S (S): | 6.1 people |
| Rohnert Park: | 2.6 people |
Percentage of family households:
| Neighborhood S (S): | 56.1% |
| Rohnert Park: | 43.9% |
| Here: | 50.5% |
| Rohnert Park: | 43.1% |
Percentage of married-couple families with children (among all households):
| Neighborhood S (S): | 34.4% |
| Rohnert Park: | 24.7% |
Percentage of single-mother households (among all households):
| Neighborhood S (S): | 4.4% |
| Rohnert Park: | 10.3% |
Percentage of never married males 15 years old and over:
Percentage of never married females 15 years old and over:
| Neighborhood S (S): | 17.2% |
| Rohnert Park: | 20.3% |
Percentage of never married females 15 years old and over:
| Neighborhood S (S): | 14.4% |
| city: | 21.1% |
Percentage of people that speak English not well or not at all:
| Neighborhood S (S): | 1.8% |
| Rohnert Park: | 3.7% |
Percentage of people born in this state:
Percentage of people born in another U.S. state:
Percentage of native residents but born outside the U.S.:
Percentage of foreign born residents:
| Here: | 68.3% |
| Rohnert Park: | 65.7% |
Percentage of people born in another U.S. state:
| Neighborhood S (S): | 12.1% |
| Rohnert Park: | 18.6% |
Percentage of native residents but born outside the U.S.:
| Here: | 2.4% |
| city: | 1.1% |
Percentage of foreign born residents:
| Here: | 17.2% |
| Rohnert Park: | 14.5% |

Owner-occupied
Renter-occupied


- Rooms in owner-occupied houses and condos in Neighborhood S <
> - 01 room
- 192 rooms
- 1563 rooms
- 764 rooms
- 585 rooms
- 736 rooms
- 877 rooms
- 368 rooms
- 539+ rooms

- Rooms in renter-occupied apartments in Neighborhood S <
> - 21 room
- 2012 rooms
- 843 rooms
- 984 rooms
- 455 rooms
- 526 rooms
- 267 rooms
- 328 rooms
- 159+ rooms
Owner-occupied
Renter-occupied

- Bedrooms in owner-occupied houses and condos in Neighborhood S <
> - 0no bedroom
- 571 bedroom
- 2732 bedrooms
- 833 bedrooms
- 814 bedrooms
- 475+ bedrooms

- Bedrooms in renter-occupied apartments in Neighborhood S <
> - 3no bedroom
- 2471 bedroom
- 2272 bedrooms
- 663 bedrooms
- 204 bedrooms
- 95+ bedrooms
Average number of cars or other vehicles available in houses/condos:
Average number of cars or other vehicles available in apartments:
| This neighborhood: | 2.0 |
| Rohnert Park: | 2.3 |
Average number of cars or other vehicles available in apartments:
| Here: | 1.9 |
| city: | 1.9 |
Percentage of units with a mortgage:
| Neighborhood S (S): | 90.6% |
| Rohnert Park: | 69.0% |
Housing prices:
- Average estimated value of detached houses in 2022 (32.1% of all units):
Neighborhood S (S): $644,724 Rohnert Park: $718,881
- Average estimated value of townhouses or other attached units in 2022 (26.6% of all units):
This neighborhood: $151,825 city: $452,176
- Average estimated '22 value of housing units in 5-or-more-unit structures (10.2% of all units):
Neighborhood S (S): $248,708 Rohnert Park: $428,045

- Year house built in Neighborhood S <
> - 692020 or later
- 172010 to 2019
- 732000 to 2009
- 521990 to 1999
- 1491980 to 1989
- 5781970 to 1979
- 261960 to 1969
- 561950 to 1959
- 131940 to 1949
- 161939 or earlier

City-data.com crime index for city in 2020 (higher means more crime):
| City: | 266.5 |
| U.S. average: | 219.5 |
Travel time to work (commute)
![Travel time to work (commute)]()
- 6Less than 5 minutes
- 565 to 9 minutes
- 5110 to 14 minutes
- 7415 to 19 minutes
- 13820 to 24 minutes
- 4925 to 29 minutes
- 6730 to 34 minutes
- 2235 to 39 minutes
- 140 to 44 minutes
- 17545 to 59 minutes
- 3960 to 89 minutes
- 4490 or more minutes

Means of transportation to work
![Means of transportation to work]()
- 86.6%1,069Drove a car alone
- 8.8%108Carpooled
- 1.4%17Bus
- 4.4%54Subway or elevated rail
- 1.5%18Motorcycle
- 1.0%12Bicycle
- 2.0%25Walked
- 0.1%1Other means
- 3.1%38Worked at home

Time leaving home to go to work
![Time leaving home to go to work]()
- 9812:00 a.m. to 4:59 a.m.
- 125:00 a.m. to 5:29 a.m.
- 305:30 a.m. to 5:59 a.m.
- 256:00 a.m. to 6:29 a.m.
- 856:30 a.m. to 6:59 a.m.
- 1237:00 a.m. to 7:29 a.m.
- 1177:30 a.m. to 7:59 a.m.
- 478:00 a.m. to 8:29 a.m.
- 418:30 a.m. to 8:59 a.m.
- 409:00 a.m. to 9:59 a.m.
- 410:00 a.m. to 10:59 a.m.
- 1511:00 a.m. to 11:59 a.m.
- 2612:00 p.m. to 3:59 p.m.
- 144:00 p.m. to 11:59 p.m.

Occupations of males:
- Percentage of males in management occupations (except farmers):
Here: 13.5% city: 10.9%
- Percentage of males in computer and mathematical occupations:
Here: 3.9% city: 4.9%
- Percentage of males in education, training, and library occupations:
Here: 1.4% city: 1.7%
- Percentage of males in healthcare practitioners and technical occupations:
Here: 2.7% city: 3.6%
- Percentage of males in service occupations:
Here: 9.7% city: 20.6%
- Percentage of males in sales and office occupations:
Here: 22.9% city: 16.7%
- Percentage of males in farming, fishing, and forestry occupations:
Here: 2.1% city: 0.5%
- Percentage of males in construction, extraction, and maintenance occupations:
Here: 20.4% city: 15.5%
- Percentage of males in production occupations:
Here: 10.4% city: 3.8%
- Percentage of males in transportation occupations:
Here: 5.3% city: 4.0%
- Percentage of males in material moving occupations:
Here: 1.4% city: 4.2%
Occupations of females:
- Percentage of females in management occupations (except farmers):
Here: 1.7% city: 7.5%
- Percentage of females in business and financial operations occupations:
Here: 4.3% city: 5.5%
- Percentage of females in architecture and engineering occupations:
Here: 3.6% city: 0.9%
- Percentage of females in community and social services occupations:
Here: 2.0% city: 3.6%
- Percentage of females in education, training, and library occupations:
Here: 6.3% city: 9.5%
- Percentage of females in arts, design, entertainment, sports, and media occupations:
Here: 1.8% city: 2.4%
- Percentage of females in healthcare practitioners and technical occupations:
Here: 21.9% city: 8.1%
- Percentage of females in service occupations:
Here: 17.4% city: 24.0%
- Percentage of females in sales and office occupations:
Here: 38.7% city: 30.9%
- Percentage of females in transportation occupations:
Here: 1.1% city: 1.0%
Percentage of people 16-64 in Armed Forces:
| Neighborhood S (S): | 2.4% |
| Rohnert Park: | 0.2% |
Education in this neighborhood (subdivision or community):
- Percentage of people 3 years and older in K-12 schools:
Neighborhood S (S): 18.6% Rohnert Park: 15.1%
- Percentage of people 3 years and older in undergraduate colleges:
Neighborhood S (S): 10.7% Rohnert Park: 10.5%
- Percentage of people 3 years and older in grad. or professional schools:
Neighborhood S (S): 0.8% Rohnert Park: 0.9%
- Percentage of students K-12 enrolled in private schools:
Neighborhood S (S): 2.9% Rohnert Park: 4.1%
Percentage of population below poverty level:
| Neighborhood S (S): | 2.3% |
| Rohnert Park: | 9.7% |
Median year owner moved in (as recorded in 2022):
Median year renter moved in (as recorded in 2022):
| Neighborhood S (S): | 2013 |
| Rohnert Park: | 2008 |
Median year renter moved in (as recorded in 2022):
| Neighborhood S (S): | 2017 |
| Rohnert Park: | 2017 |
Percentage of married-couple families with both working:
| Neighborhood S (S): | 77.9% |
| Rohnert Park: | 74.9% |

- 54.8%Utility gas
- 29.1%Electricity
- 5.2%No fuel used
- 4.3%Wood
- 2.2%Solar energy
- 2.0%Other fuel
- 1.4%Bottled, tank, or LP gas
- 1.2%Fuel oil, kerosene, etc.
Roads and streets:
Rohnert Park Expy
Length: 1.39 miles
Directions: E-W, SE-NW
Directions: E-W, SE-NW
Santa Cruz Way
Length: 0.81 miles
Directions: E-W, N-S, SE-NW, SW-NE
Address range: 900 to 1199
Directions: E-W, N-S, SE-NW, SW-NE
Address range: 900 to 1199
San Francisco Way
Length: 0.61 miles
Directions: E-W, SW-NE
Address range: 900 to 1098
Directions: E-W, SW-NE
Address range: 900 to 1098
Snyder Ln
Length: 0.34 miles
Direction: N-S
Address range: 5202 to 5359
Direction: N-S
Address range: 5202 to 5359
San Benito Dr (San Benito Way)
Length: 0.27 miles
Directions: E-W, N-S, SE-NW, SW-NE
Address range: 6250 to 6375
Directions: E-W, N-S, SE-NW, SW-NE
Address range: 6250 to 6375
San Antonio Dr
Length: 0.19 miles
Directions: E-W, SW-NE
Address range: 1100 to 1199
Directions: E-W, SW-NE
Address range: 1100 to 1199
Santa Clara Ct (Santa Clara Pl)
Length: 0.16 miles
Directions: N-S, SW-NE
Address range: 6171 to 6399
Directions: N-S, SW-NE
Address range: 6171 to 6399
Country Club Dr
Length: 0.15 miles
Direction: N-S
Address range: 6100 to 6199
Direction: N-S
Address range: 6100 to 6199
San Ramon Pl
Length: 0.14 miles
Directions: N-S, SW-NE
Address range: 6170 to 6206
Directions: N-S, SW-NE
Address range: 6170 to 6206
San Gabriel Pl
Length: 0.12 miles
Direction: N-S
Address range: 6170 to 6208
Direction: N-S
Address range: 6170 to 6208
San Carlos Ct
Length: 0.11 miles
Directions: N-S, SW-NE
Address range: 6170 to 6206
Directions: N-S, SW-NE
Address range: 6170 to 6206
San Simeon Dr
Length: 0.11 miles
Direction: SW-NE
Address range: 6354 to 6399
Direction: SW-NE
Address range: 6354 to 6399
San Mateo Ct
Length: 0.08 miles
Directions: N-S, SW-NE
Address range: 6170 to 6206
Directions: N-S, SW-NE
Address range: 6170 to 6206
San Bruno Ct
Length: 0.06 miles
Directions: E-W, SW-NE
Address range: 6159 to 6206
Directions: E-W, SW-NE
Address range: 6159 to 6206
San Rafael Ct
Length: 0.06 miles
Directions: N-S, SW-NE
Address range: 6344 to 6399
Directions: N-S, SW-NE
Address range: 6344 to 6399
San Francisco Ct
Length: 0.06 miles
Direction: SW-NE
Address range: 6344 to 6399
Direction: SW-NE
Address range: 6344 to 6399
Santa Clara Pl
Length: 0.05 miles
Direction: SW-NE
Address range: 6273 to 6356
Direction: SW-NE
Address range: 6273 to 6356
San Miguel Ct
Length: 0.04 miles
Direction: SE-NW
Address range: 6170 to 6206
Direction: SE-NW
Address range: 6170 to 6206
San Benito Way (San Benito Ct)
Length: 0.03 miles
Direction: N-S
Address range: 6100 to 6249
Direction: N-S
Address range: 6100 to 6249
Other features:
Hinebaugh Crk
Length: 0.70 miles
Direction: E-W
Direction: E-W