Neighborhood G (G) neighborhood in Rohnert Park, California (CA), 94928 detailed profile
Settings
X


Business Search - 14 Million verified businesses
Area: 0.281 square miles
Population: 773
Population density:
| Neighborhood G (G): | 2,747 people per square mile |
| Rohnert Park: | 6,910 people per square mile |

- 57067.9%White
- 15618.6%Hispanic or Latino
- 445.2%Black
- 435.1%Asian
- 263.1%American Indian

Median household income in 2022:
| Neighborhood G (G): | $119,337 |
| Rohnert Park: | $93,322 |
Distribution of median household income
![Distribution of median household income]()
- 28Less than $10,000
- 23$10,000 to $19,999
- 15$20,000 to $29,999
- 22$30,000 to $39,999
- 9$40,000 to $49,999
- 12$50,000 to $59,999
- 8$60,000 to $74,999
- 47$75,000 to $99,999
- 32$100,000 to $124,999
- 32$125,000 to $149,999
- 64$150,000 to $199,999
- 31$200,000 or more

Distribution of owner-occupied house/condo value
![Distribution of owner-occupied house/condo value]()
- 8Less than $50,000
- 67$50,000 to $99,999
- 9$100,000 to $149,999
- 2$300,000 to $399,999
- 20$400,000 to $499,999
- 128$500,000 to $749,999
- 46$750,000 to $999,999
- 27$1,000,000 or more

Distribution of rent paid by renters
![Distribution of rent paid by renters]()
- 19Less than $100
- 24$500 to $599
- 8$700 to $799
- 11$900 to $999
- 3$1,000 to $1,249
- 4$1,250 to $1,499
- 12$1,500 to $1,999
- 68$2,000 or more

Median rent in 2022:
| Neighborhood G (G): | $2,548 |
| Rohnert Park: | $1,984 |
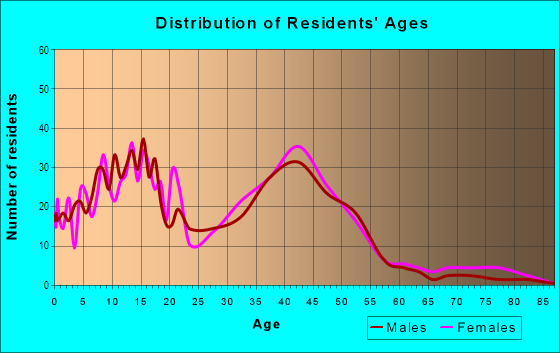
| Males: | 385 |
| Females: | 388 |
Males:
| This neighborhood: | 40.9 years |
| Whole city: | 35.9 years |
| This neighborhood: | 44.4 years |
| Whole city: | 34.5 years |
Average household size:
| Neighborhood G (G): | 2.6 people |
| Rohnert Park: | 2.6 people |
Percentage of family households:
| Neighborhood G (G): | 51.1% |
| Rohnert Park: | 43.9% |
| Here: | 57.0% |
| Rohnert Park: | 43.1% |
Percentage of married-couple families with children (among all households):
| Neighborhood G (G): | 27.3% |
| Rohnert Park: | 24.7% |
Percentage of single-mother households (among all households):
| Neighborhood G (G): | 10.1% |
| Rohnert Park: | 10.3% |
Percentage of never married males 15 years old and over:
Percentage of never married females 15 years old and over:
| Neighborhood G (G): | 14.7% |
| Rohnert Park: | 20.3% |
Percentage of never married females 15 years old and over:
| Neighborhood G (G): | 12.5% |
| city: | 21.1% |
Percentage of people that speak English not well or not at all:
| Neighborhood G (G): | 0.3% |
| Rohnert Park: | 3.7% |
Percentage of people born in this state:
Percentage of people born in another U.S. state:
Percentage of native residents but born outside the U.S.:
Percentage of foreign born residents:
| Here: | 63.6% |
| Rohnert Park: | 65.7% |
Percentage of people born in another U.S. state:
| Neighborhood G (G): | 26.8% |
| Rohnert Park: | 18.6% |
Percentage of native residents but born outside the U.S.:
| Here: | 1.5% |
| city: | 1.1% |
Percentage of foreign born residents:
| Here: | 8.1% |
| Rohnert Park: | 14.5% |

Owner-occupied
Renter-occupied


- Rooms in owner-occupied houses and condos in Neighborhood G <
> - 01 room
- 42 rooms
- 13 rooms
- 134 rooms
- 825 rooms
- 576 rooms
- 277 rooms
- 68 rooms
- 219+ rooms

- Rooms in renter-occupied apartments in Neighborhood G <
> - 31 room
- 112 rooms
- 193 rooms
- 114 rooms
- 265 rooms
- 66 rooms
- 337 rooms
- 38 rooms
- 79+ rooms
Owner-occupied
Renter-occupied

- Bedrooms in owner-occupied houses and condos in Neighborhood G <
> - 0no bedroom
- 41 bedroom
- 82 bedrooms
- 1673 bedrooms
- 334 bedrooms
- 95+ bedrooms

- Bedrooms in renter-occupied apartments in Neighborhood G <
> - 5no bedroom
- 301 bedroom
- 392 bedrooms
- 593 bedrooms
- 154 bedrooms
- 75+ bedrooms
Average number of cars or other vehicles available in houses/condos:
Average number of cars or other vehicles available in apartments:
| This neighborhood: | 2.4 |
| Rohnert Park: | 2.3 |
Average number of cars or other vehicles available in apartments:
| Here: | 2.1 |
| city: | 1.9 |
Percentage of units with a mortgage:
| Neighborhood G (G): | 72.0% |
| Rohnert Park: | 69.0% |

- Year house built in Neighborhood G <
> - 202020 or later
- 512010 to 2019
- 242000 to 2009
- 151990 to 1999
- 2291980 to 1989
- 341970 to 1979
- 81960 to 1969
- 21950 to 1959
- 11940 to 1949
- 61939 or earlier

City-data.com crime index for city in 2020 (higher means more crime):
| City: | 266.5 |
| U.S. average: | 219.5 |
Travel time to work (commute)
![Travel time to work (commute)]()
- 265 to 9 minutes
- 4210 to 14 minutes
- 7615 to 19 minutes
- 5420 to 24 minutes
- 2225 to 29 minutes
- 4830 to 34 minutes
- 735 to 39 minutes
- 1140 to 44 minutes
- 4245 to 59 minutes
- 5160 to 89 minutes
- 1190 or more minutes

Means of transportation to work
![Means of transportation to work]()
- 83.8%326Drove a car alone
- 8.0%31Carpooled
- 4.1%16Bus
- 1.0%4Long-distance train or commuter rail
- 1.0%4Taxi
- 1.5%6Motorcycle
- 1.0%4Bicycle
- 2.8%11Other means
- 27.0%105Worked at home

Time leaving home to go to work
![Time leaving home to go to work]()
- 4012:00 a.m. to 4:59 a.m.
- 145:00 a.m. to 5:29 a.m.
- 225:30 a.m. to 5:59 a.m.
- 276:00 a.m. to 6:29 a.m.
- 256:30 a.m. to 6:59 a.m.
- 407:00 a.m. to 7:29 a.m.
- 507:30 a.m. to 7:59 a.m.
- 428:00 a.m. to 8:29 a.m.
- 368:30 a.m. to 8:59 a.m.
- 309:00 a.m. to 9:59 a.m.
- 310:00 a.m. to 10:59 a.m.
- 311:00 a.m. to 11:59 a.m.
- 1212:00 p.m. to 3:59 p.m.
- 304:00 p.m. to 11:59 p.m.

Occupations of males:
- Percentage of males in management occupations (except farmers):
Here: 15.3% city: 10.9%
- Percentage of males in business and financial operations occupations:
Here: 3.7% city: 3.0%
- Percentage of males in computer and mathematical occupations:
Here: 4.6% city: 4.9%
- Percentage of males in community and social services occupations:
Here: 1.7% city: 0.3%
- Percentage of males in legal occupations:
Here: 8.9% city: 1.0%
- Percentage of males in education, training, and library occupations:
Here: 1.3% city: 1.7%
- Percentage of males in healthcare practitioners and technical occupations:
Here: 5.2% city: 3.6%
- Percentage of males in service occupations:
Here: 12.6% city: 20.6%
- Percentage of males in sales and office occupations:
Here: 27.0% city: 16.7%
- Percentage of males in construction, extraction, and maintenance occupations:
Here: 7.0% city: 15.5%
- Percentage of males in transportation occupations:
Here: 4.3% city: 4.0%
- Percentage of males in material moving occupations:
Here: 2.8% city: 4.2%
Occupations of females:
- Percentage of females in management occupations (except farmers):
Here: 8.0% city: 7.5%
- Percentage of females in business and financial operations occupations:
Here: 4.6% city: 5.5%
- Percentage of females in architecture and engineering occupations:
Here: 2.0% city: 0.9%
- Percentage of females in education, training, and library occupations:
Here: 7.2% city: 9.5%
- Percentage of females in healthcare practitioners and technical occupations:
Here: 9.3% city: 8.1%
- Percentage of females in service occupations:
Here: 23.5% city: 24.0%
- Percentage of females in sales and office occupations:
Here: 39.0% city: 30.9%
- Percentage of females in production occupations:
Here: 4.6% city: 2.3%
Education in this neighborhood (subdivision or community):
- Percentage of people 3 years and older in K-12 schools:
Neighborhood G (G): 17.0% Rohnert Park: 15.1%
- Percentage of people 3 years and older in undergraduate colleges:
Neighborhood G (G): 6.2% Rohnert Park: 10.5%
- Percentage of people 3 years and older in grad. or professional schools:
Neighborhood G (G): 8.0% Rohnert Park: 0.9%
- Percentage of students K-12 enrolled in private schools:
Neighborhood G (G): 28.0% Rohnert Park: 4.1%
Percentage of population below poverty level:
| Neighborhood G (G): | 7.0% |
| Rohnert Park: | 9.7% |
Median year owner moved in (as recorded in 2022):
Median year renter moved in (as recorded in 2022):
| Neighborhood G (G): | 2006 |
| Rohnert Park: | 2008 |
Median year renter moved in (as recorded in 2022):
| Neighborhood G (G): | 2016 |
| Rohnert Park: | 2017 |
Percentage of married-couple families with both working:
| Neighborhood G (G): | 76.7% |
| Rohnert Park: | 74.9% |

- 70.7%Utility gas
- 19.3%Electricity
- 2.4%Solar energy
- 2.3%Wood
- 2.0%No fuel used
- 1.3%Bottled, tank, or LP gas
- 1.1%Fuel oil, kerosene, etc.
- 0.9%Other fuel
Roads and streets:
Snyder Ln
Length: 0.89 miles
Directions: N-S, SE-NW, SW-NE
Directions: N-S, SE-NW, SW-NE
Golf Course Dr
Length: 0.85 miles
Direction: E-W
Address range: 1514 to 1571
Direction: E-W
Address range: 1514 to 1571
Holly Ave
Length: 0.65 miles
Directions: E-W, SW-NE
Address range: 1294 to 1599
Directions: E-W, SW-NE
Address range: 1294 to 1599
Moura Ln (Baumgardner Ln)
Length: 0.65 miles
Direction: E-W
Address range: 1100 to 1799
Direction: E-W
Address range: 1100 to 1799
Gold Way
Length: 0.44 miles
Directions: E-W, N-S, SE-NW, SW-NE
Address range: 1406 to 1467
Directions: E-W, N-S, SE-NW, SW-NE
Address range: 1406 to 1467
Gladstone Way
Length: 0.34 miles
Directions: E-W, N-S, SE-NW
Address range: 1500 to 1699
Directions: E-W, N-S, SE-NW
Address range: 1500 to 1699
Grandview Way
Length: 0.29 miles
Direction: N-S
Address range: 4300 to 4335
Direction: N-S
Address range: 4300 to 4335
Gillpepper Ln
Length: 0.26 miles
Directions: E-W, N-S, SW-NE
Address range: 1300 to 1423
Directions: E-W, N-S, SW-NE
Address range: 1300 to 1423
Georgia Ct
Length: 0.22 miles
Direction: E-W
Address range: 1400 to 1499
Direction: E-W
Address range: 1400 to 1499
Griffin Way
Length: 0.20 miles
Direction: E-W
Address range: 1500 to 1549
Direction: E-W
Address range: 1500 to 1549
Goodson Way
Length: 0.19 miles
Directions: E-W, N-S, SE-NW, SW-NE
Address range: 4300 to 4399
Directions: E-W, N-S, SE-NW, SW-NE
Address range: 4300 to 4399
Graywhaler Ln
Length: 0.19 miles
Direction: N-S
Address range: 4400 to 4499
Direction: N-S
Address range: 4400 to 4499
Graymill Ct
Length: 0.18 miles
Direction: E-W
Address range: 1314 to 1399
Direction: E-W
Address range: 1314 to 1399
Gaspar Ct
Length: 0.18 miles
Direction: E-W
Address range: 1300 to 1383
Direction: E-W
Address range: 1300 to 1383
Garmont Ct
Length: 0.18 miles
Direction: E-W
Address range: 1300 to 1381
Direction: E-W
Address range: 1300 to 1381
Gary Ct
Length: 0.17 miles
Direction: E-W
Address range: 1500 to 1581
Direction: E-W
Address range: 1500 to 1581
Garfield Ct
Length: 0.17 miles
Direction: E-W
Address range: 1500 to 1580
Direction: E-W
Address range: 1500 to 1580
Gretchen Ct
Length: 0.16 miles
Direction: E-W
Address range: 1500 to 1581
Direction: E-W
Address range: 1500 to 1581
Gordon Way
Length: 0.16 miles
Direction: N-S
Direction: N-S
Gregory Ct
Length: 0.14 miles
Direction: E-W
Address range: 1400 to 1468
Direction: E-W
Address range: 1400 to 1468
Garrett Ct
Length: 0.14 miles
Direction: E-W
Address range: 1400 to 1466
Direction: E-W
Address range: 1400 to 1466
Gensis Ct (Genesis Ct)
Length: 0.14 miles
Direction: E-W
Address range: 1500 to 1548
Direction: E-W
Address range: 1500 to 1548
Galaxy Ct
Length: 0.14 miles
Direction: E-W
Address range: 1301 to 1547
Direction: E-W
Address range: 1301 to 1547
Gillford Ln (Gilford Ln)
Length: 0.13 miles
Direction: N-S
Address range: 4300 to 4352
Direction: N-S
Address range: 4300 to 4352
Gavin Way
Length: 0.13 miles
Direction: N-S
Direction: N-S
Gloria Ct
Length: 0.08 miles
Direction: N-S
Address range: 4301 to 4376
Direction: N-S
Address range: 4301 to 4376
Grace Ct
Length: 0.08 miles
Direction: N-S
Address range: 4300 to 4354
Direction: N-S
Address range: 4300 to 4354
Grove Ct
Length: 0.04 miles
Direction: N-S
Address range: 4301 to 4342
Direction: N-S
Address range: 4301 to 4342
Glacier Ct
Length: 0.03 miles
Directions: N-S, SW-NE
Address range: 4400 to 4413
Directions: N-S, SW-NE
Address range: 4400 to 4413
Grange Ct
Length: 0.03 miles
Direction: N-S
Address range: 4300 to 4324
Direction: N-S
Address range: 4300 to 4324
Heritage Ln
Length: 0.01 miles
Direction: E-W
Address range: 4394 to 4399
Direction: E-W
Address range: 4394 to 4399